Figure 4.

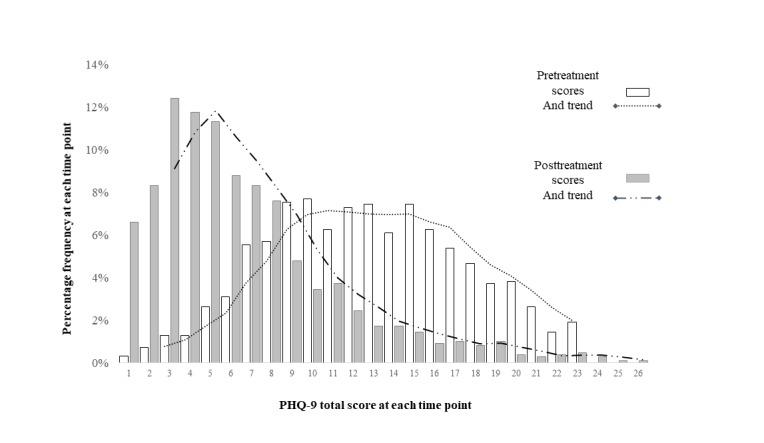
Dispersion of symptom scores (nine-item Patient Health Questionnaire, PHQ-9) at pretreatment (in light bars) and posttreatment scores (in dark bars). The dotted trend lines are indicative of the shape of each distribution.

Dispersion of symptom scores (nine-item Patient Health Questionnaire, PHQ-9) at pretreatment (in light bars) and posttreatment scores (in dark bars). The dotted trend lines are indicative of the shape of each distribution.