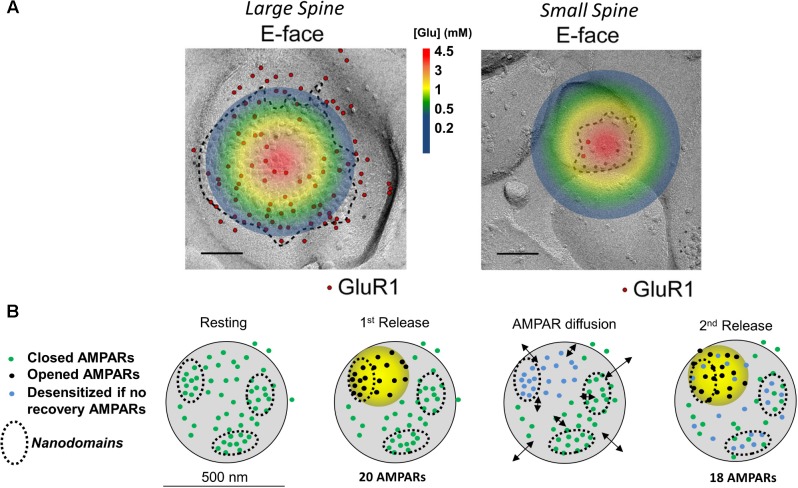
FIGURE 1.
Image and legend reprinted from Shinohara and Hirase (2009). (A) Examples of paired SDS-digested freeze-fracture replica labeling (SDS-FRL) for GluR1 (E-face) at large vs. small spines in CA1 of stratum radiatum synapses (old nomenclature for AMPAR subunits is used). Colored circle represents the extent of glutamate spread 50 μs post vesicular fusion as predicted by Raghavachari and Lisman (2004). Approximate colored scaled for glutamate concentrations shown in between images (in mM). Scale bars: 100 nm. (B) Conceptual model of AMPAR mobility during paired-pulse stimulation. Diagram of a large mushroom spine with realistic AMPAR content randomly distributed thought the space in small nanodomains (black circles). Zone of high glutamate concentration is illustrated by the yellow circle and should follow the color schemed shown above. Three different states for AMPAR are assigned: closed (green color), opened (black), and desensitized (blue). Four states are shown: resting (left), 1st release, AMPAR diffusion, and 2nd release. Estimated synaptic response is shown above as a one to one correspondence between number of AMPAR and size of response.

