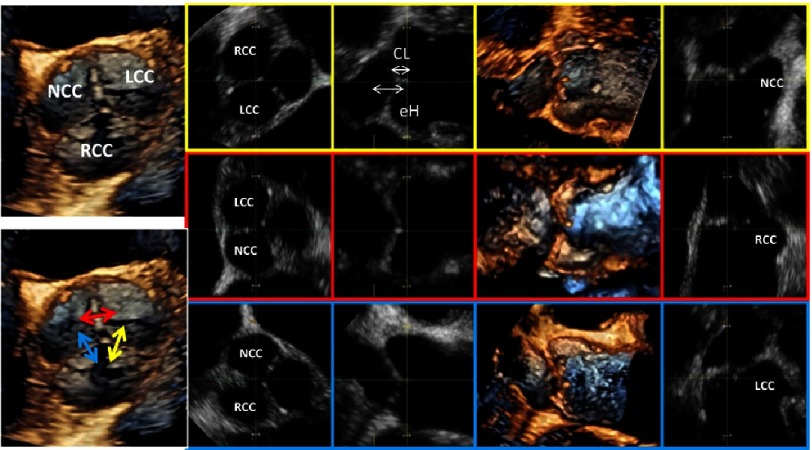
Figure 13. On the left side an en-face view of a normal tricuspid AV is shown.
The yellow highlighted images (first line) show the post-processing of correct sectional planes for measurement of CL and eH between the RCC and LCC, the red highlighted images (second line) show corresponding post-processing analysis of CL and eH between the LCC and NCC and the blue highlighted images (third line) show corresponding post-processing analysis of CL and eH between the NCC and RCC.

