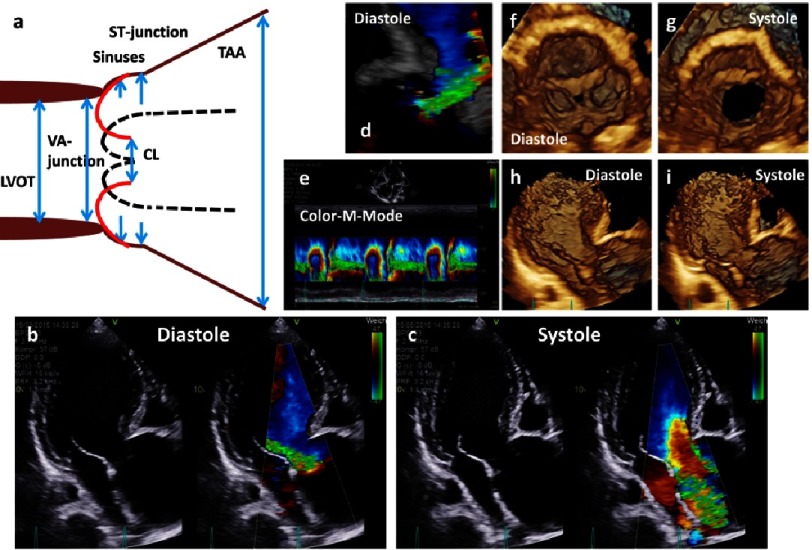
Figure 16. The scheme shows an ectasia of the sinuses of Valsalva and a severe aneurysm of the proximal TAA (a).
Below native and color-coded 2D transthoracic images are shown during diastole (b) and systole (c). In addition, 3D TTE image of the aortic regurgitation during diastole (d), color M-Mode of the regurgitation (e), en-face views of the aortic annulus during diastole (f) and systole (g) and 3D transthoracic images of long axis views during diastole (h) and systole (i) are shown.

