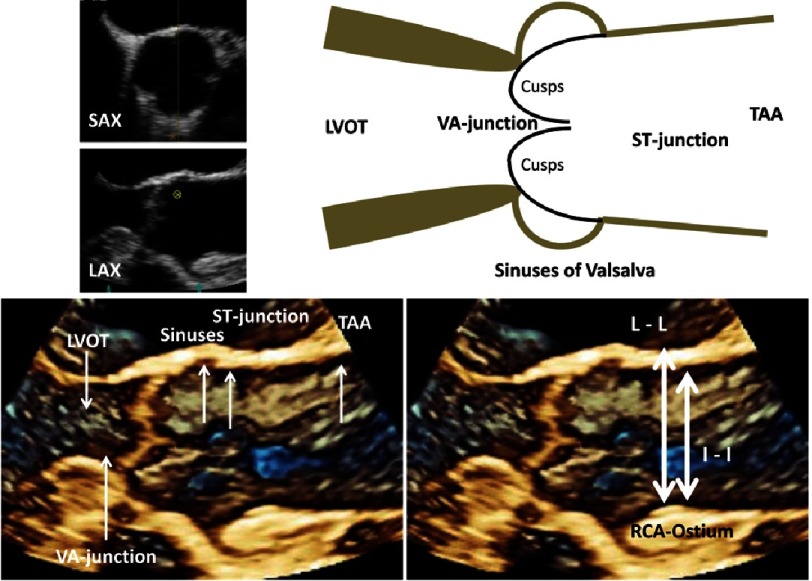
Figure 5. Scheme of the LVOT and the aortic root including 3D TEE-Illustrations of the AV and the aortic root during diastole (left below).
The characteristic structures are labeled by white arrows (abbreviations see text). The differences between leading edge to leading edge (L-L) and inner edge to inner edge (I-I) are documented for the diameter of ST-junction (right below).

