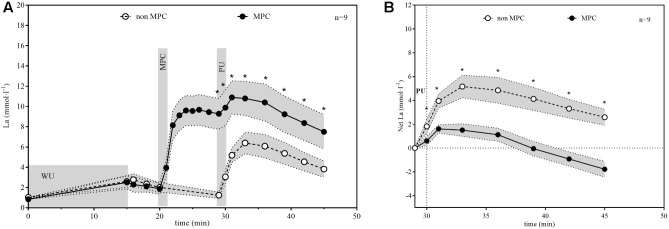
FIGURE 4.
(A) Lactate (La) concentration in non-MPC and MPC (means ± 95%CI). (B) Net La increase during pull-up exercise (PU) and recovery (means ± 95%CI). MPC increases La to high levels followed by a reduced La increase in PU and recovery compared to no MPC. Net La increase was significant reduced in the MPC (∗p < 0.01).

