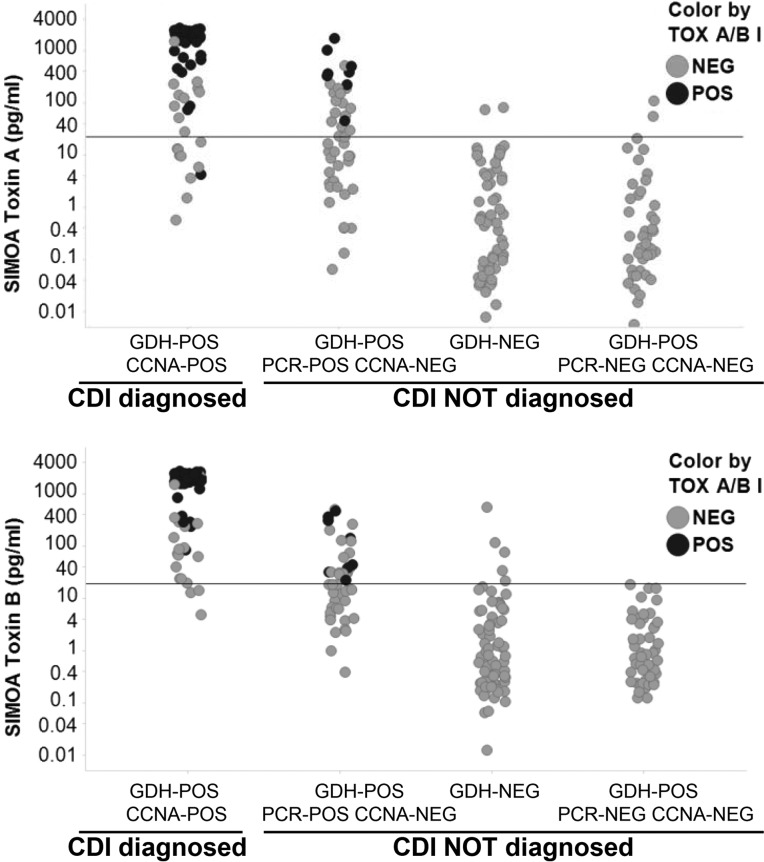
FIG 4.
SIMOA toxin A and toxin B assay results according to laboratory case definition of CDI and comparison to C. difficile TOX A/B II assay results. Toxin A and toxin B concentrations measured with SIMOA assays in each diluted sample (n = 240) are plotted according to the CDI status of the patient, CDI diagnosed (GDH- and Leeds CCNA-positive sample) or CDI not diagnosed (GDH- and/or Leeds CCNA-negative sample). The positivity thresholds of SIMOA toxin A and toxin B assays are indicated by a line on each figure (toxin A, 22.1 pg/ml; toxin B, 18.8 pg/ml). Each circle corresponds to a quantity of toxin determined by SIMOA assays, and dark circles represents the sample which are positive by the C. difficile TOX A/B II assay. Toxin concentrations in the graph are not corrected by the dilution factor.

