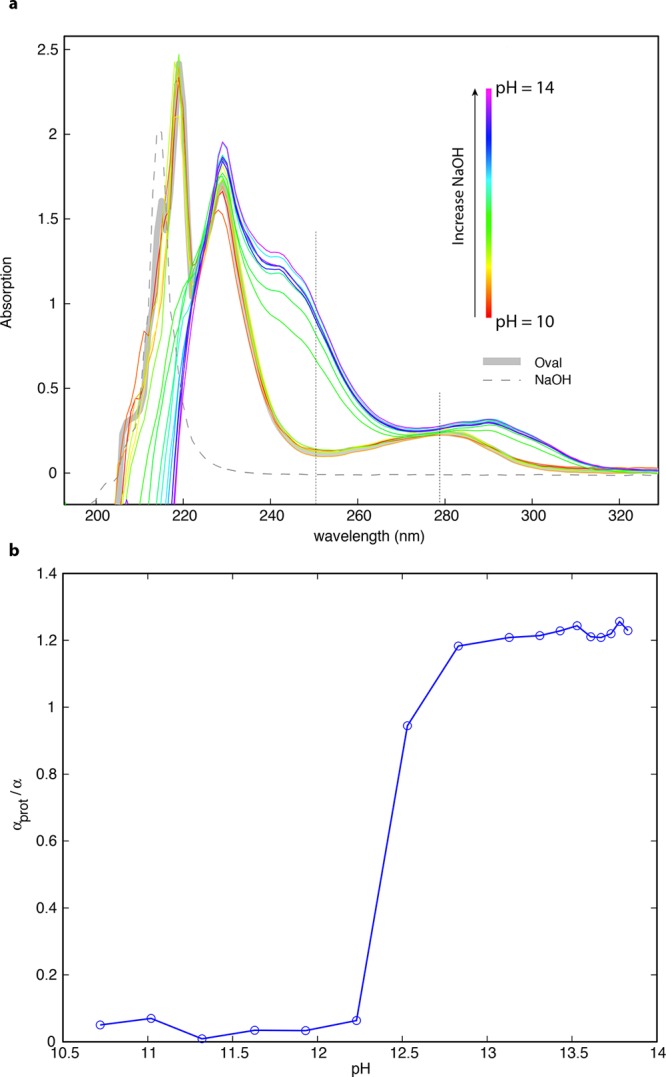
Figure 4.

Tyrosine oxidation assay. (a) UV absorbance spectra of ovalbumin solutions in the pH range 10–14. Gray solid line shows the absorption spectrum of ovalbumin at neural pH. Gray dashed line shows the absorption spectrum of 2 M NaOH solution alone. Remaining spectra are color-coded in rainbow order with red lines indicating ovalbumin solution with pH ∼ 10 and violet lines indicating ovalbumin solution with pH ∼ 14. The absorbance at 250 nm is associated with tyrosine, and increases with tyrosine oxidation; the absorbance at 280 nm indicates tryptophan absorbance. A dramatic, nonlinear change in ovalbumin structure, as indicated by tyrosine oxidation, occurs between pH 12.3 and pH 13.0. (b) Parameter αprot/α (tyrosine oxidation per protein molecular weight) as a function of pH; αprot/α indicates the number of tyrosines exposed relative to the average molecular weight of the protein. Tyrosine oxidation is unchanged from the native state, but undergoes a sharp increase between pH 12.25 and 12.5. Pidan formation occurs between pH 12.5 and pH 13. There is a slower increase in tyrosine oxidation from pH 13 to pH 13.5, where it appears to reach a maximum. At pH greater than 13.5, ovalbumin gels slowly degraded, perhaps due to cleavage of the protein backbone.
