
Figure 5.
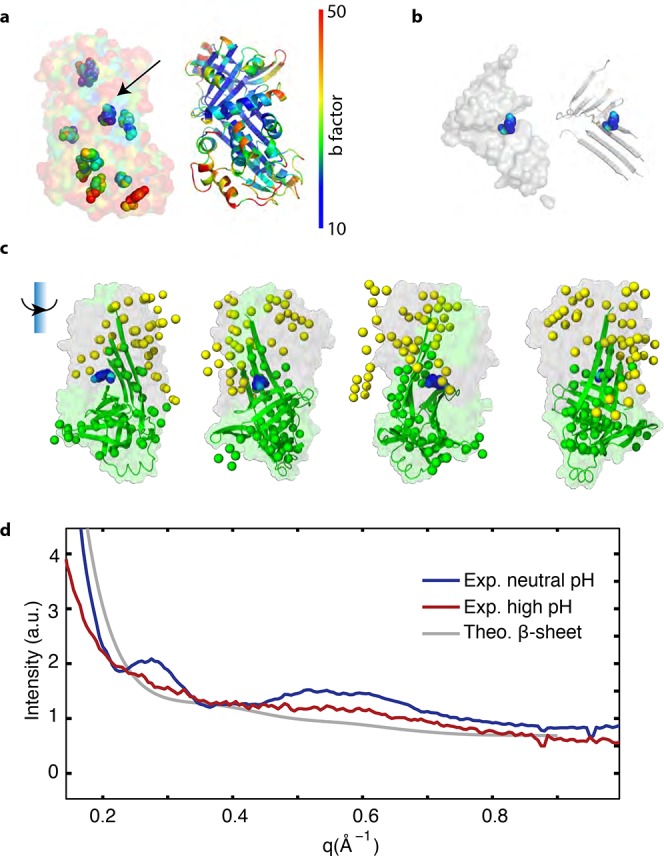
Estimation of the secondary structure of ovalbumin in pidan. (a) b-factors of 1OVA (transparent surface), highlighting tyrosines (filled spheres). Arrow indicates the tyrosine with a b-factor one standard deviation lower than the average tyrosine in 1OVA. This residue is likely the one most buried from solvent exposure. The ribbon structure of 1OVA is shown to the right. (b) Isolated β-sheet structure of ovalbumin. The left image shows the surface, and the right shows the ribbon structure. 1OVA contains eight β-strands forming two β-sheets. The most stable tyrosine (shown as spheres colored by b-factor) is located at the closest point of contact between these two sheets. (c) Multiple views of the β-sheet structure of ovalbumin (surface) superimposed with a numerical prediction of the protein structure of pidan gels (green and yellow spheres). Each rotation represents 90° around the axis indicated. Green spheres show regions that overlap well with the β-sheet structure of ovalbumin, which may serve as the hard core of a patchy particle. Green and gray surfaces are the regions of the native protein structure predicted to remain folded, and to unfold, respectively. Regions of numerical prediction that do not overlap with crystal structure are shown in yellow; these areas are also predicted to be disordered and potentially sites of general polar, attractive interactions. (d) WAXS I(q), characterizing structure internal to a protein, of raw egg white (blue curve), pidan (red curve), and a calculated form factor of only the β-sheet structure from native ovalbumin (1OVA, gray curve). WAXS of pidan is intermediate between that of the native protein and the isolated β-sheet of the native protein, suggesting that the native protein undergoes a partial unfolding leaving the β-sheets and little additional structure in the pidan conformation.