Figure 6.
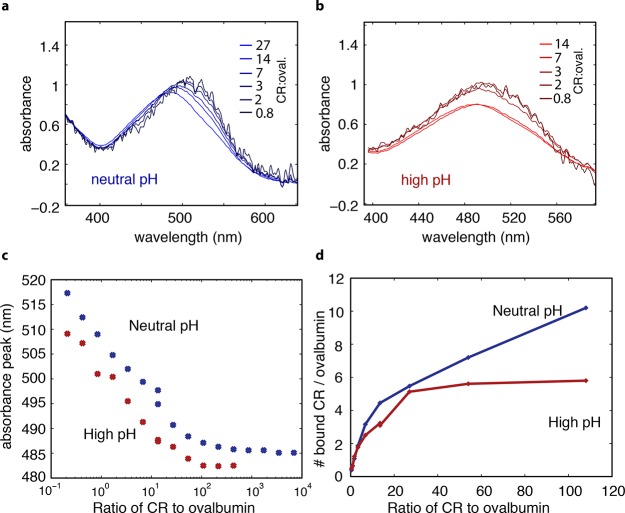
Surface area of folded regions of ovalbumin (Ova) estimated by Congo red (CR) binding assay. (a) Visible absorbance of CR over a range of CR:ovalbumin concentration from 0.8 to 27, neutral pH. CR bound to ovalbumin secondary structure absorbs at a longer wavelength than CR free in solution, so as ovalbumin is added to the solution relative to CR, thereby increasing opportunities for CR to bind ovalbumin, the overall absorption of the system shifts to the right. (b) Same as part a, but in 0.5 M NaOH with the CR:Ova concentration from 0.8 to 14. A similar peak shift, of a smaller overall magnitude, was observed at high pH. (c) CR absorbance peak as a function of CR:Ova concentration ratio. Blue symbols label CR:Ova at neutral pH, and red symbols label CR:Ova in high pH consistent with pidan formation. (d) Calculated number of CR bound to one ovalbumin monomer as a function of CR:Ova concentration ratios for both neural pH (blue) and high pH (red). Because CR only binds to secondary structure but not random coil, this assay allows us to estimate the surface area of secondary structure in the native protein compared to that of the conformation found in pidan. The results suggest that the pidan conformation consists of some secondary structure, and that the surface area of secondary structure is roughly 60% that of the native conformation.

