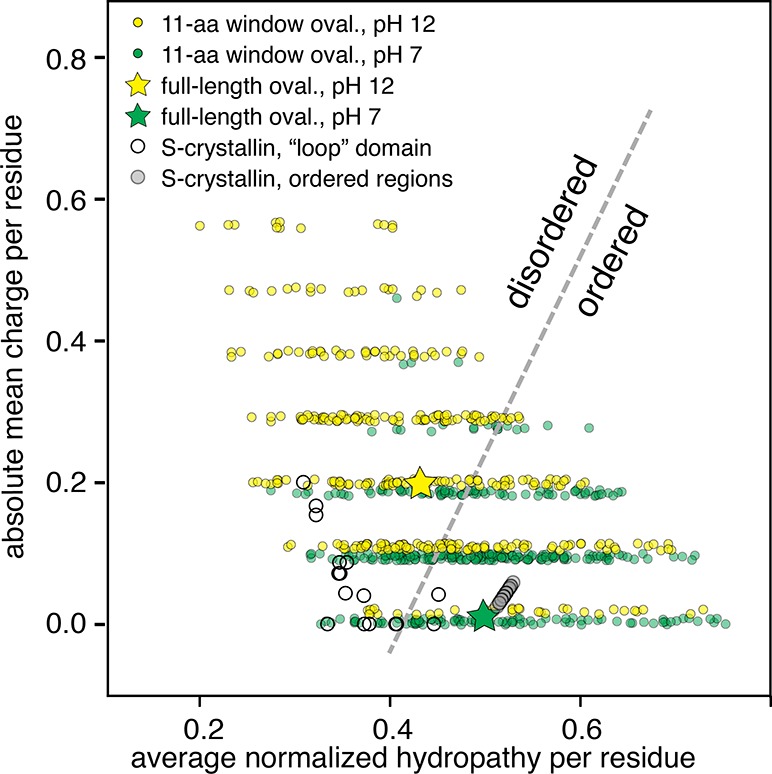
Figure 8.

Protein order vs intrinsic disorder is determined by the location of a sequence within the space describing average net charge of a residue vs average normalized hydrophobicity of a residue in a protein. The yellow star shows the location of the entire ovalbumin sequence at pH 12; the green star shows the location of ovalbumin at pH 7. Yellow dots represent a single 11-residue window of ovalbumin at pH 12, while green dots represent the same windows at pH 7. The high-pH ovalbumin is predicted to be in the disordered region. The S-Crystallin loop structure (empty dots) and the rest (gray dots) are also plotted. The loops are mostly locating at the disordered region, whereas the rest of the S-Crystallin form a line in the ordered region.
