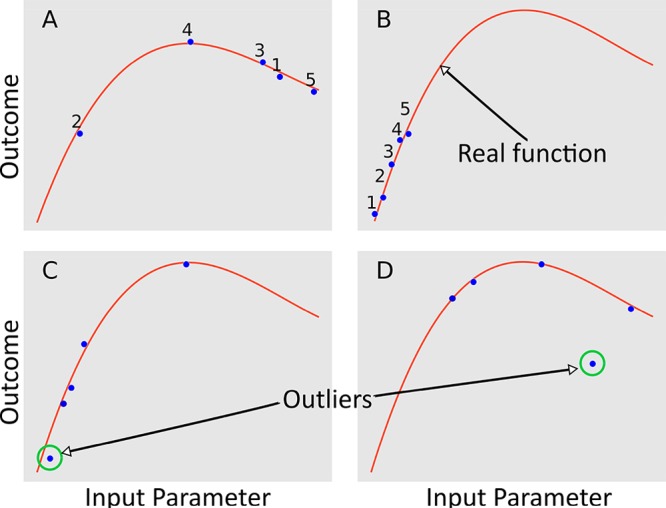
Figure 9.

Model of the five first experiments conducted in a 1D system, whose surface is the red line, randomly (A) and with a brute-force approach (B). (C, D) Examples of outliers where the former has an outcome that is a statistical outlier from the three experiments, and the latter is an outlier due to a deviation from the real outcome surface.
