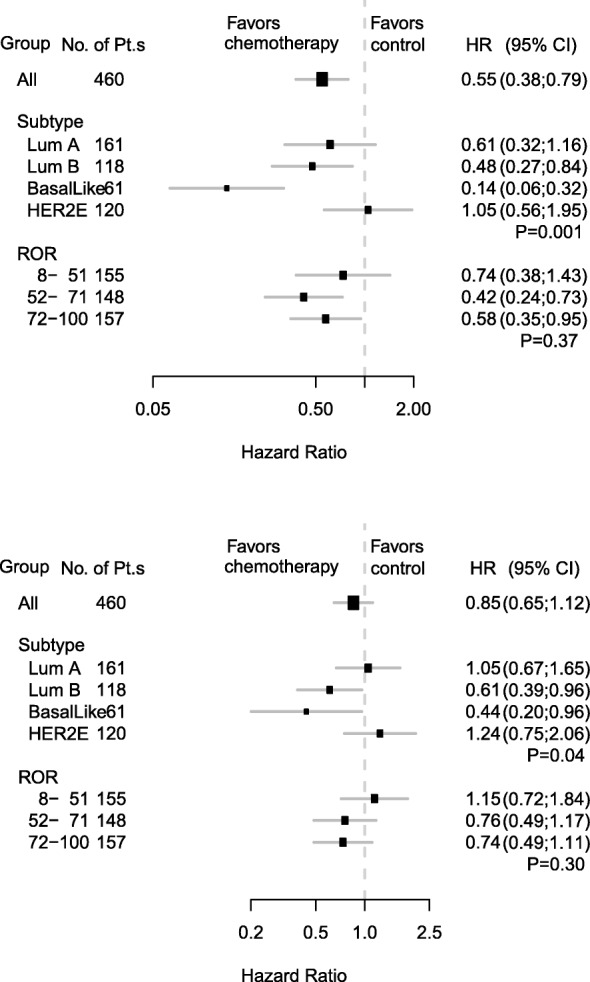
Fig. 3.

Forest plots illustrate proportional hazard models for disease-free survival (a) and overall survival (b) overall and according to intrinsic cancer subtype and risk of recurrence (ROR) score, respectively. Hazard ratios refer to adjusted estimates obtained in the multivariate analysis. P values are for test of heterogeneity of treatment effect. Boxes represent the weight of data for each subgroup relative to the total data. Pt.s, patients; Lum, luminal; HER2E, human epidermal growth factor receptor 2-enriched
