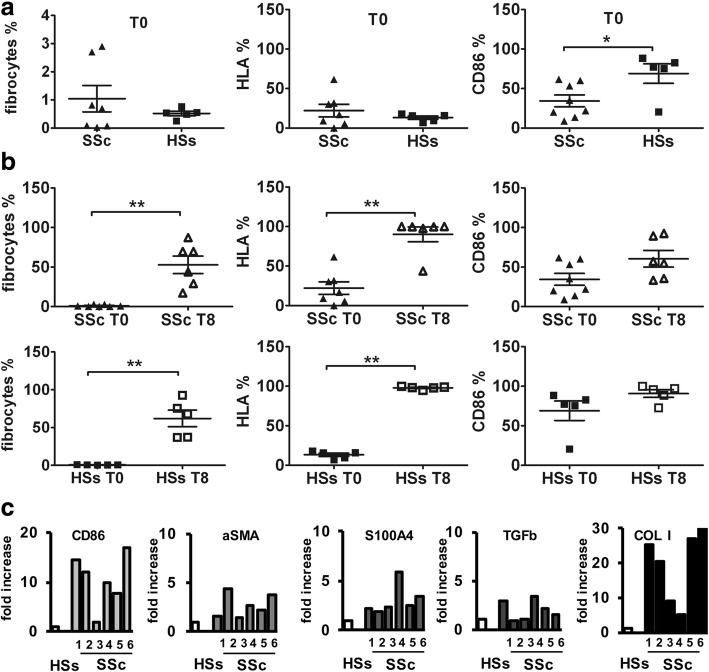
Fig. 1.
Characterization of systemic sclerosis (SSc) and healthy subject (HS) fibrocytes at basal time (T0) and at 8 days of culture (T8). a FACS analysis of SSc and HS fibrocytes, identified among the CD45+ cells, as CD45+, COL I+, CXCR4+, and relative HLA-DR and CD86 expression at T0; b FACS analysis of SSc and HS fibrocytes, identified among the CD45+ cells, as CD45+, COL I+, CXCR4+, and relative HLA-DR and CD86 expression at T0 and T8. c Quantitative RT-PCR analysis for CD86, αSMA, S100A4, TGFβ, and COL I gene expression of cultured SSc fibrocytes (T8), compared with HS fibrocytes (T8), taken as the calibrator

