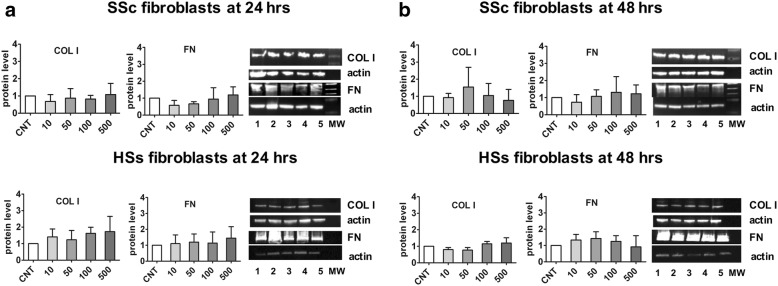
Fig. 4.
Western blot analysis of COL I and FN on cultured systemic sclerosis (SSc) and healthy subject (HS) fibroblasts after 24 and 48 h of CTLA4-Ig treatment. Western blotting analysis of COL I and FN in cultured SSc and HS fibroblasts. Western blotting of COL I and FN, and related densitometric analysis on cultured SSc and HS fibroblasts either untreated (CNT) or treated for 24 h (a) and 48 h (b) with various concentrations of CTLA4-Ig (line 1: CNT, calibrator; line 2: CTLA4-Ig 10 μg/ml: line 3: CTLA4-Ig 50 μg/ml; line 4: CTLA4-Ig 100 μg/ml; line 5: CTLA4-Ig 500 μg/ml; line 6: Molecular Weight)

