
Fig. 2.
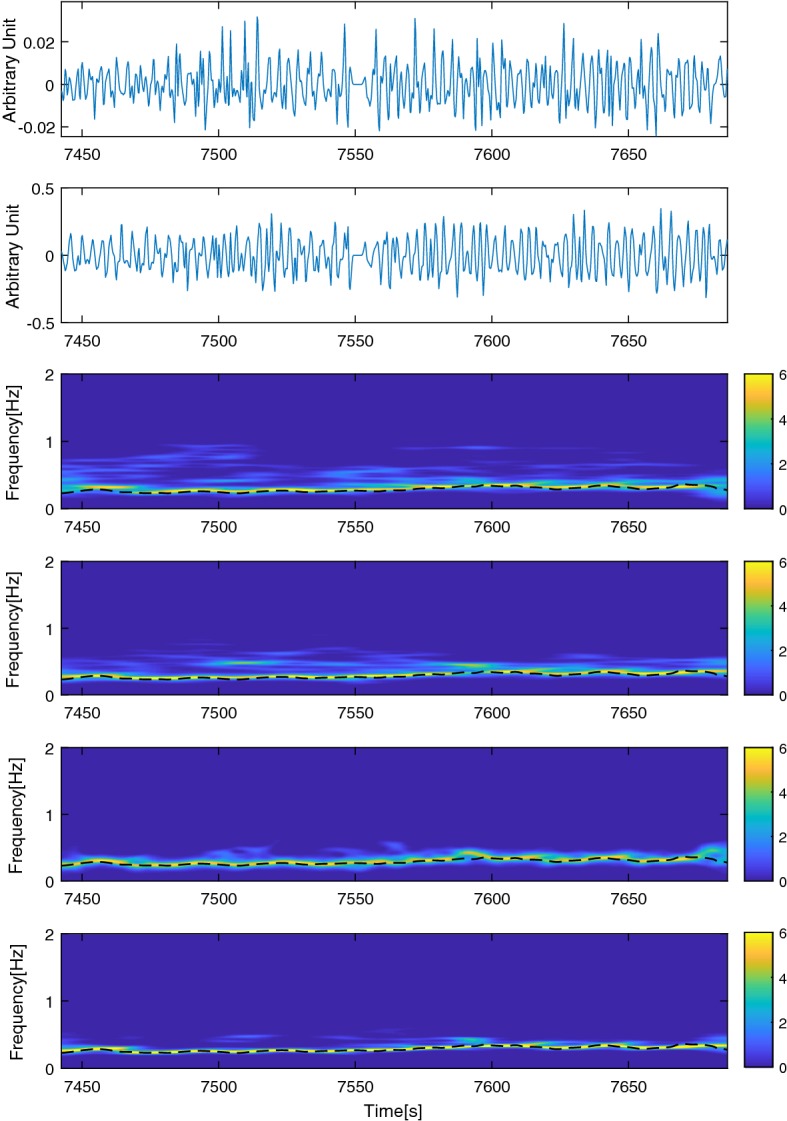
Preprocessed signals plus the representation of them and their fusions. This figure shows an epoch of the time series, RRI and MSV after preprocessing in the first and second top sub-figures. Assuming RRI and MSV signals as x and y, time–frequency representations of x and y are depicted in the third and fourth sub-figures ( and , respectively). Normalized squared magnitude of CPSD () is represented in the second last sub-figure. The last spectrogram is the normalized spectral multiplication of MSV and RRI ( ). states as Z-score column-wise normalization. The dashed lines over the time–frequency representations are the reference BF