
Fig. 1.
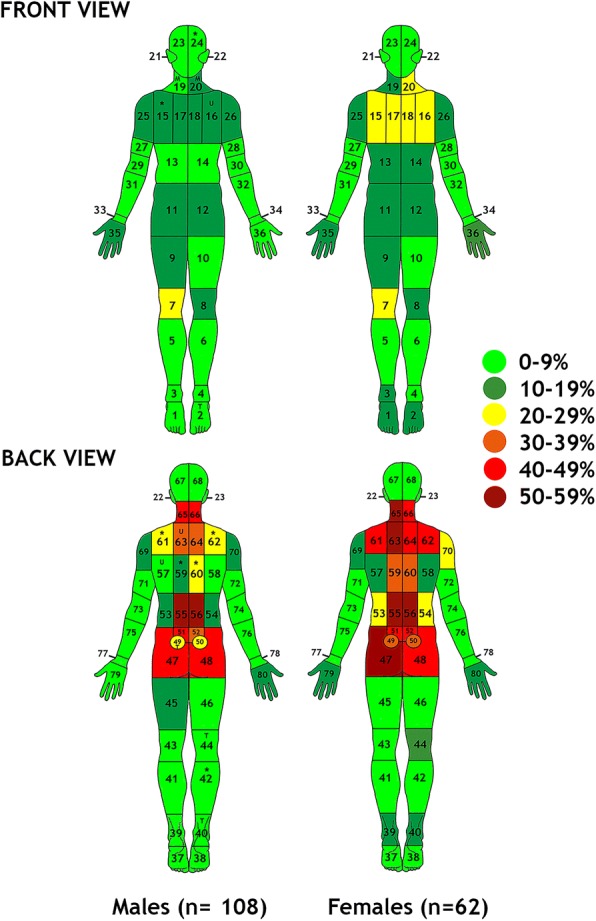
Graphical illustration of pain locations displayed as prevalence estimates for the total group and by gender in patients with axial spondyloarthritis (n = 170). * p < .05 in both univariate chi-square and multivariate logistical regression analyses; U p < .05 only in univariate analysis; M p < .05 only multivariate analysis; T p < .05 in univariate but trend in multivariate analysis