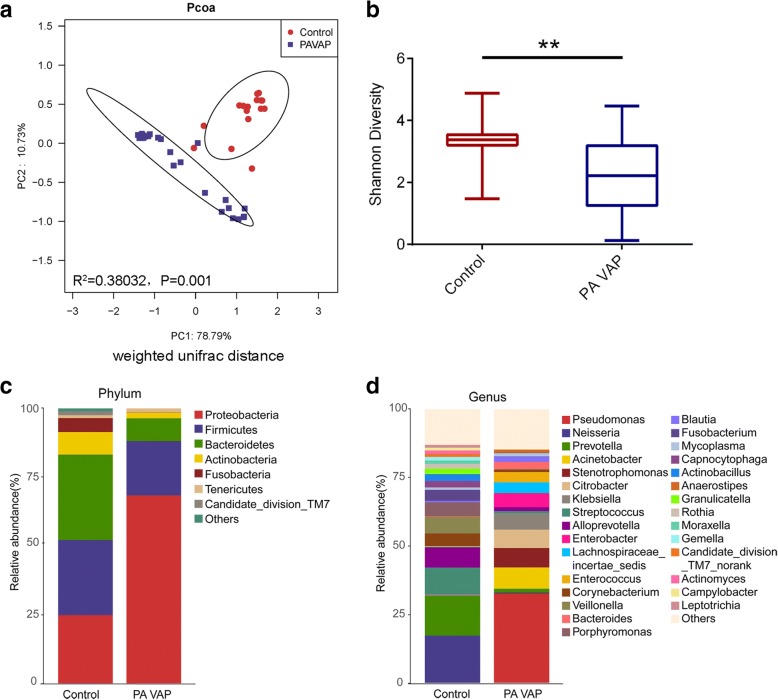
Fig. 1.
The LRT microbiota of P. aeruginosa VAP patients was significantly different from that of the controls. Samples from day1 were collected for analysis. a The weighted unifrac distance between the LRT microbiota of each sample shown as a Pcoa two-dimensional map. Each dot represents one sample. b Shannon diversity index of the P. aeruginosa VAP group was significantly lower than those in the control group. c and d Histogram of lower respiratory tract microbial composition at phylum level (c) and at genus level (d) in P. aeruginosa VAP patients and control subjects. Data were presented as mean ± Standard deviation. The difference between groups was analyzed using the Mann-Whitney test, **P < 0.01. Control, control group; PAVAP, Pseudomonas aeruginosa VAP group

