Fig. 1.
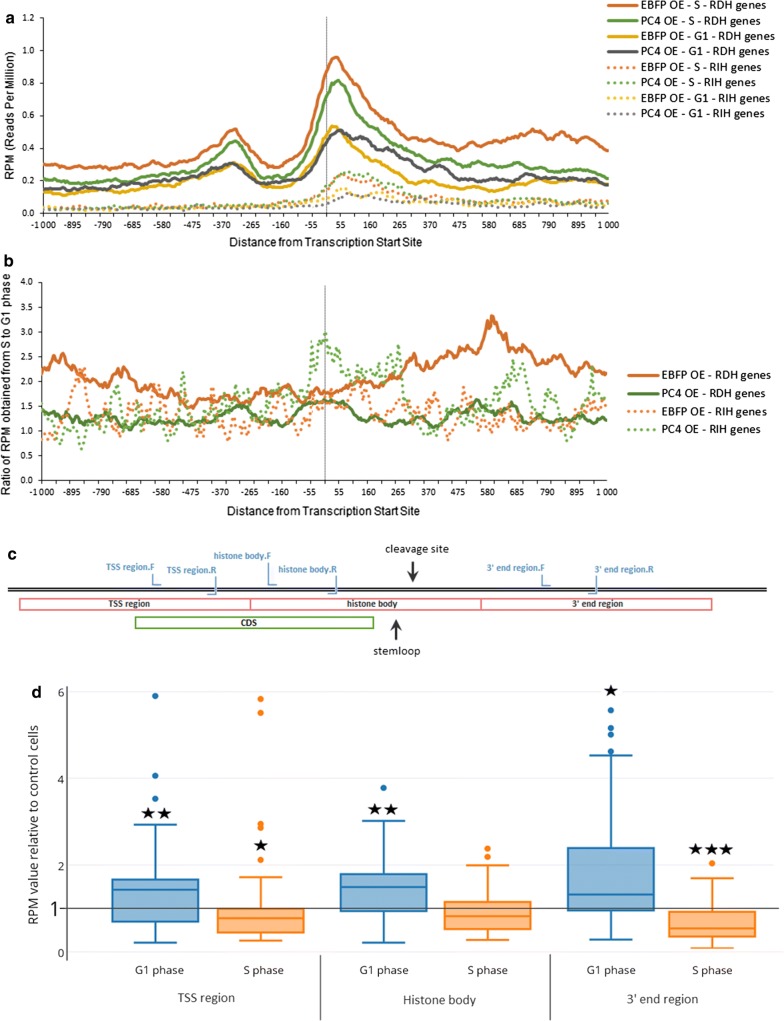
ChIP-seq analysis of PC4 overexpressing cells synchronized to G1 and S phase revealed changes in RNAP2 occupancy on RDH genes. a Profile of RNAP2 occupancy on all RHD and RIH loci in the range of 1000 base pairs upstream and 1000 base pairs downstream of the transcription start site (TSS, marked by vertical line). b Panel representing the ratio between reads per million (RPM) obtained from S phase to RPM obtained from G1 phase called “transcription activation in S phase” factor; TSS marked by vertical line. c A diagram of a RDH gene (an example on HIST1H3D) showing the location of primers used and regions analyzed in ChIP experiments. d Box plot of RNAP2 occupancy on 57 (out of 68) RDH genes in 400 nucleotides-long ranges: “TSS region”, “histone body” and “3′ end” in G1 phase- and S phase-synchronized cells with PC4 overexpression. Error bars indicate standard deviations (SD) of three biological replicates. P-values were calculated using Student’s T-test and statistical significance is represented as follows: *P ≤ 0,1; **P ≤ 0,05; ***P ≤ 0,003

