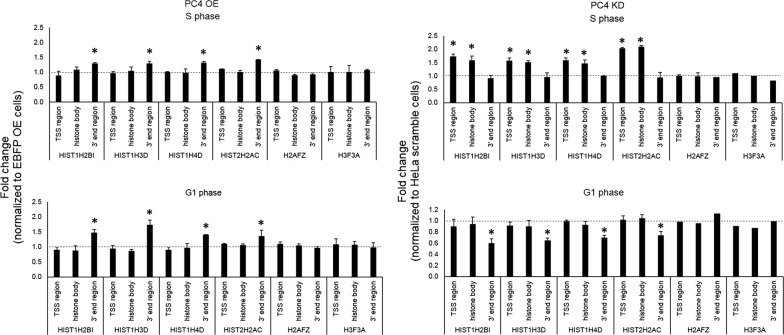
Fig. 3.
Influence of PC4 on the levels of RDH mRNAs. RT-qPCR analysis of four selected RDH (and two RIH) genes was performed in PC4 OE (left panel) and PC4 KD (right panel) cells synchronized to S or G1 phase. Regions marked as described in Fig. 1c. Error bars indicate standard deviations (SD) of three biological replicates. P-values were calculated on relative level of expression values using Student’s T-test and statistical significance is represented as follows: *P ≤ 0.05

