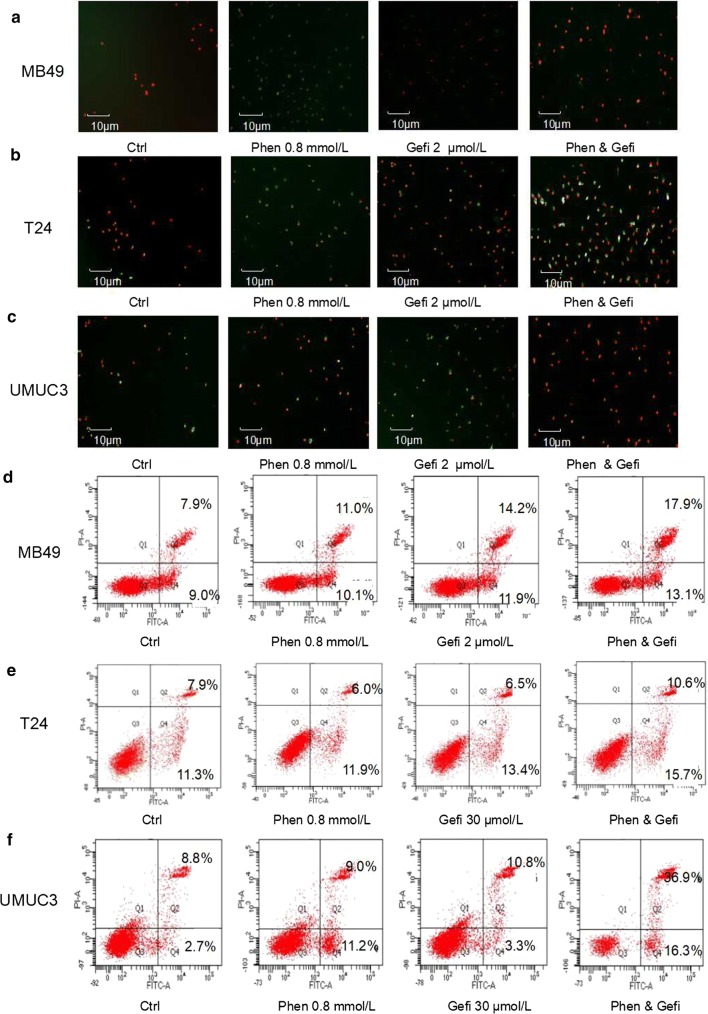
Fig. 12.
Effect of gefitinib combined with phenformin on apoptosis. a–c Fluorescence micrographs to assess FITC and propidium iodide staining of MB49, T24, and UMUC3 cell lines treated with the indicated drugs. Control cells received no drugs. d–f Representative flow cytometry scatter plots showing propidium iodide (y axis) and Annexin V-FITC (x axis) staining. Quantitation of flow cytometry experiments. Results are the mean ± SD of three independent experiments. *P < 0.05, #P < 0.01 vs. control

