Fig. 4.
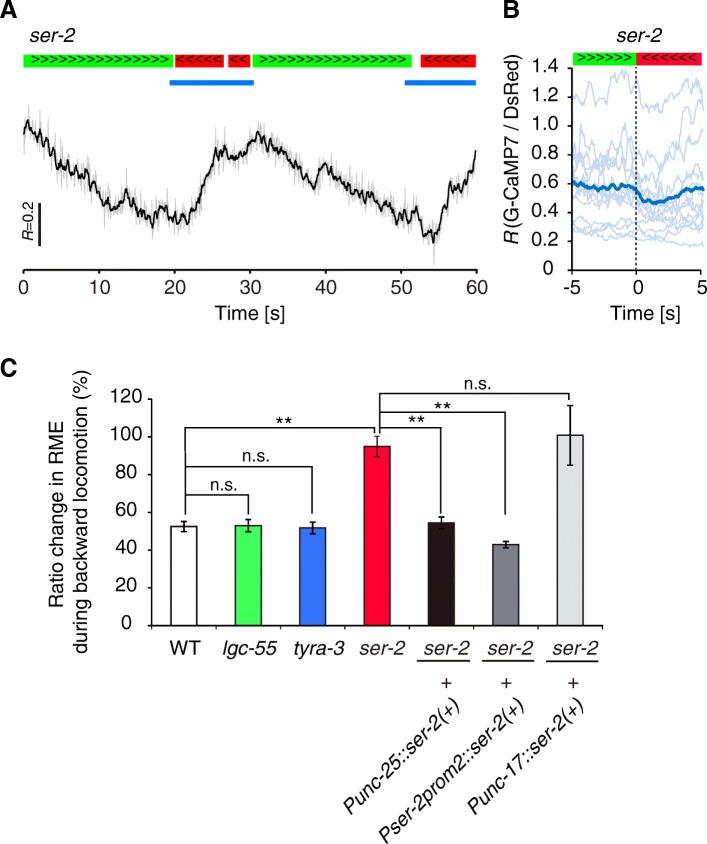
RME calcium activity is regulated by SER-2. a Representative calcium trace of RME in the ser-2 (ok2103) mutant. The gray line shows the fluorescence ratio value (R: G-CaMP/DsRed) and the black line shows moving averages of R. Periods of forward (green bars) and backward (red bars) locomotion and photostimulation (blue bars) are shown. b Calcium dynamics of directional switching (t = 0) from forward (green bar) to backward (red bar) movements. Light-blue lines show raw data from individual animals, and the dark-blue line shows mean values (n = 15 from six animals). c Rescue experiments of the ser-2 mutant. Mean fluorescence ratio changes of RME during backward movement were quantitatively analyzed in tyramine receptor mutants and ser-2 rescue transgenic lines. WT data were derived from Fig. 1g (n = 8–14 from 5 to 7 animals). **P < 0.01, *P < 0.05, n.s. = not significant, one-way ANOVA with Tukey’s test. Error bars, SEM

