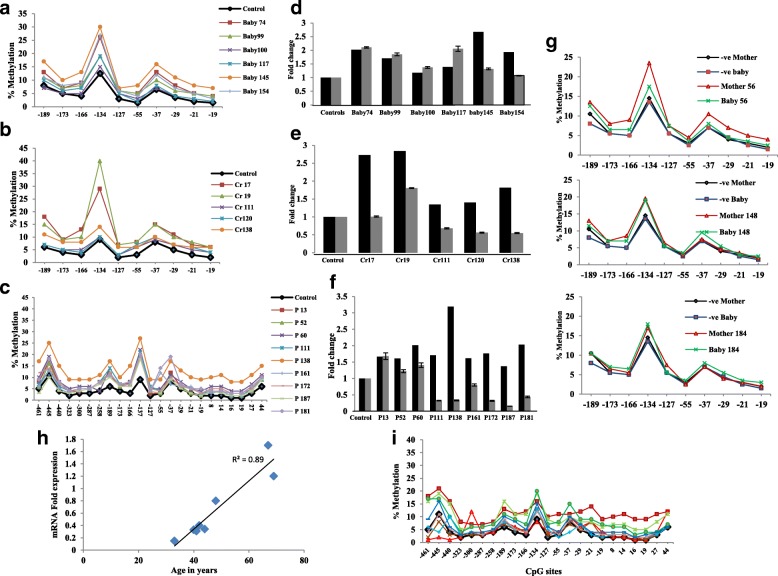
Fig. 2.
Methylation plots for BRCA1 promoter measured by bisulfite pyrosequencing assay. Levels and pattern of methylation of CpG sites along the BRCA1 promoter region in WBC from a newborn carriers, b woman carriers, c breast cancer patients, and i ovarian cancer patients. g Methylation plots for mother-newborn pairs. Black lines represent average values for control unmethylated samples, and colored lines represent single individuals. Numbers represent CpG sites relative to transcription start site. d–f Effect of promoter methylation on BRCA1 mRNA expression in WBC from newborn carriers, woman carriers, and breast cancer patients, respectively. Black bars represent fold change in BRCA1 promoter methylation. Gray bars represent fold change in BRCA1 expression. Cr carrier, P patient. h Correlation between BRCA1 mRNA levels in WBC and patient age. R2 correlation coefficient

