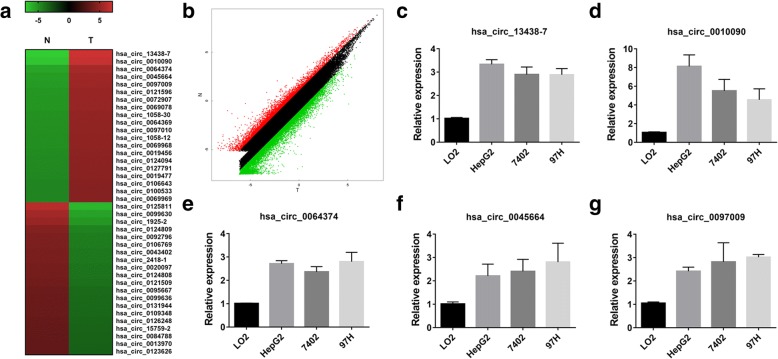
Fig. 1.
circRNA expression profiles in HCC. a The cluster heat map showed the top 20 upregulated and downregulated circRNAs in HCC tissues. Red color indicates high expression level and green color indicates low expression level. b The scatter plot revealed the variation in circRNA expression between HCC tissues and matched para-carcinoma normal tissues. The values of x and y axes were the normalized signal values of the samples (log2 scaled). c-g qRT-PCR was performed to verify the expression of the top five upregulated circRNAs in HCC cell lines. All the data are shown as the mean ± S.D

