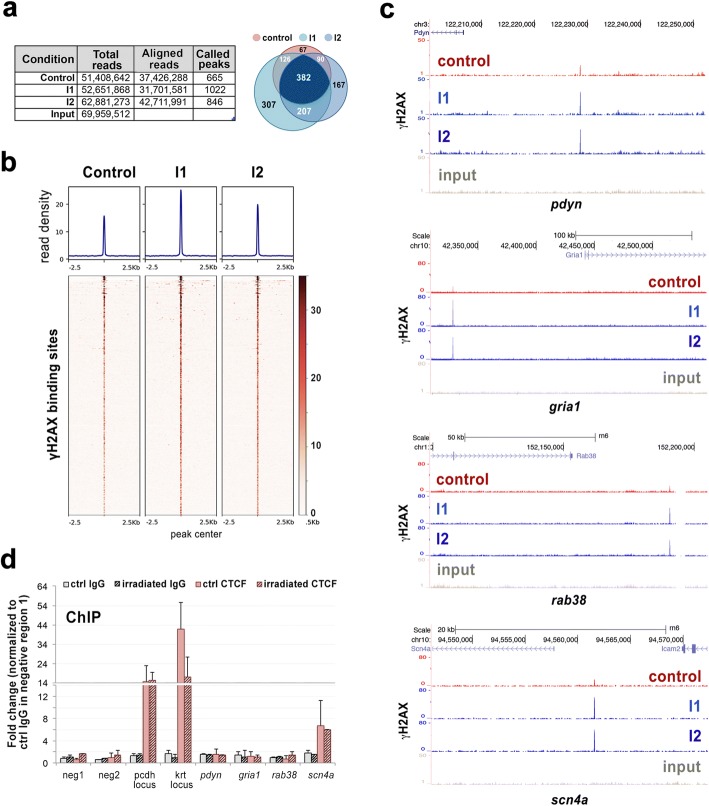
Fig. 5.
Genome wide distribution of γH2AX in rat cortical neurons 15d upon IR shows persistent DNA damage in specific genomic regions. a Table shows the number of total reads, uniquely aligned reads and called peaks for control and irradiated (I1 and I2) rat cortical neurons. Venn diagram shows the overlap (at least one nucleotide) between the called peaks defined in the different conditions. b Read density plots and heatmaps show genome-wide γH2AX distribution in the conditions described in a. c UCSC browser images showing γH2AX binding in different genomic regions close to neuronal specific processes and pathologies. d ChIP-qPCR analysis of CTCF enrichment around several γH2AX binding sites defined by ChIP-seq. Immunoprecipitation with rabbit IgG was performed to ensure antibody specificity. Neg1 and neg2 correspond to genomic regions with undetectable γH2AX binding. Pcdh and krt loci were used as positive CTCF binding sites. Graph represents the results of two independent biological replicates performed in triplicates.

