
Fig. 3.
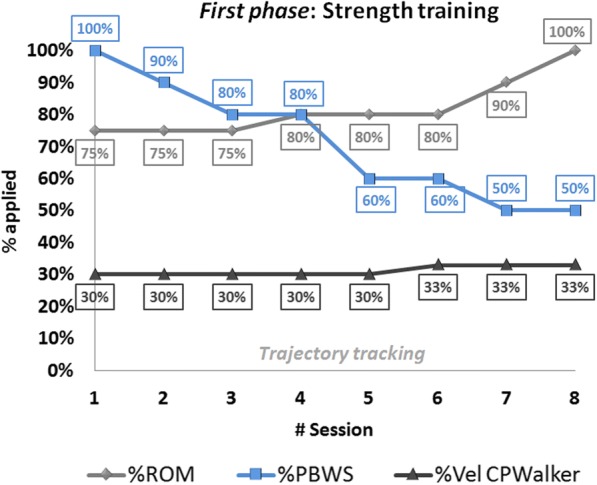
First phase: strength training progression values along first 8 sessions of the robot-based therapy. Trajectory tracking motion was imposed by the robot. The light-gray line represents the movement amplitude (%ROM), the blue line the changes of %PBWS and the dark-gray line is referred to gait velocity percentage for each session