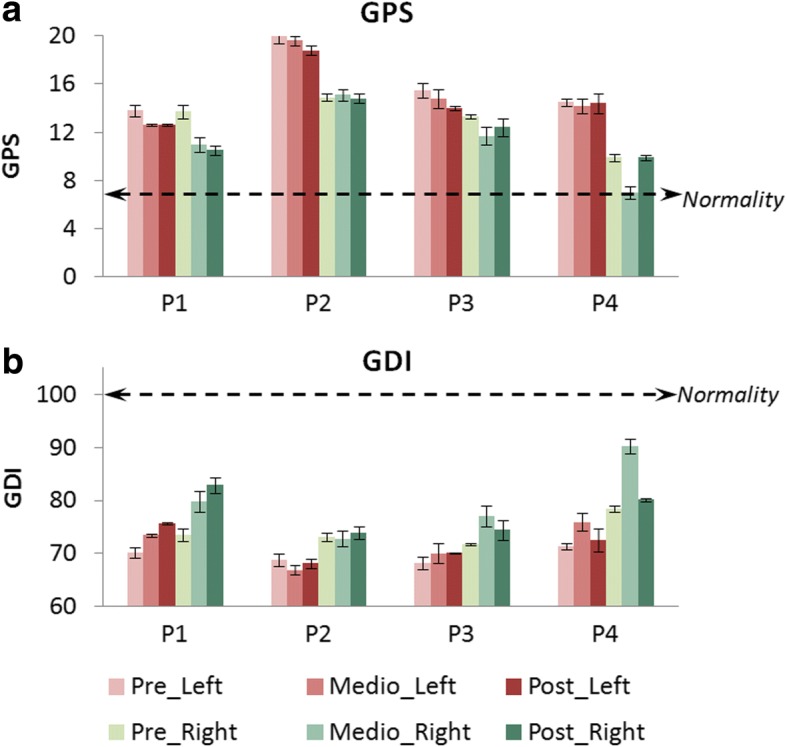
Fig. 8.

a GPS and b GDI for pre, middle and post kinematic analyzes of patients P1 to P4. The results represent means ± standard error bilaterally (left in red bars and right in green bars). Normality in GPS considers values lower than 7 points (doted-black line in (a)), and normality in GDI comprehends values higher than 100 points (doted-black line in (b))
