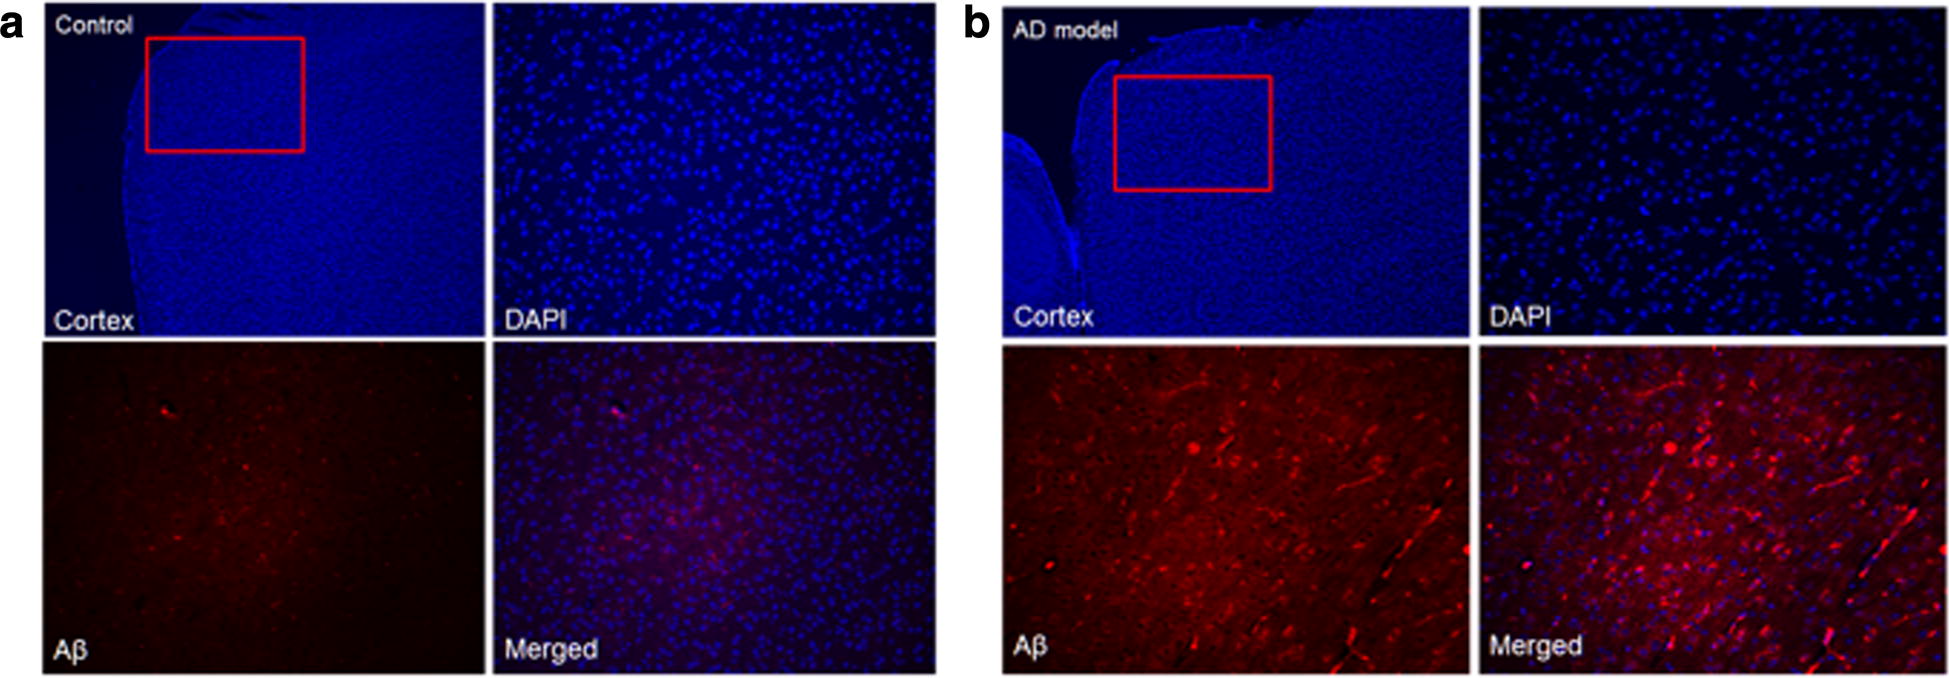
Fig. 10.

Visual overview of the Aβ40 staining images of cortex in a wild type and b AD mouse. In each group, right upper row shows DAPI (blue channel), Left lower panel shows Aβ40 (RFP red channel with specific staining signal) and Right column shows merged image. In wild type mouse, there was no Aβ 40 expression in the cortex. In contrast, the Aa40 expression of AD transgenic mouse significantly increased
