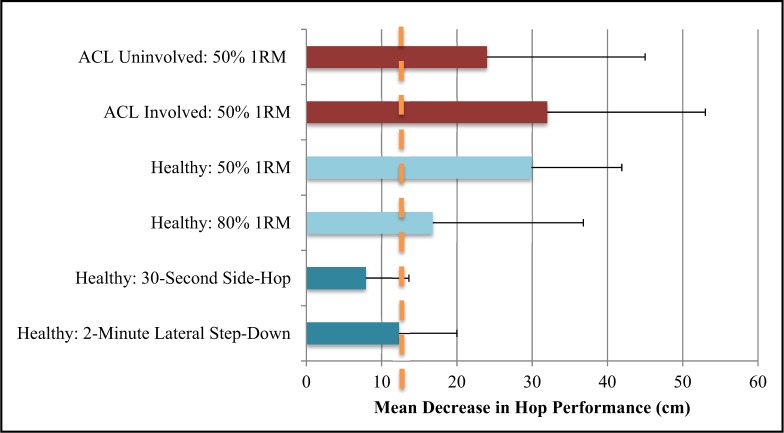
Figure 4.
Results of mean decrease in hop performance of our study and adapted data from Augustsson et al. Shades of blue indicate healthy subject values, shades of red indicate non-healthy values. Values shown are in centimeters of change in hop distance between pre-and post-fatigue of fatigue protocols. The vertical line indicates the minimal detectable change 13-14 cm.18

