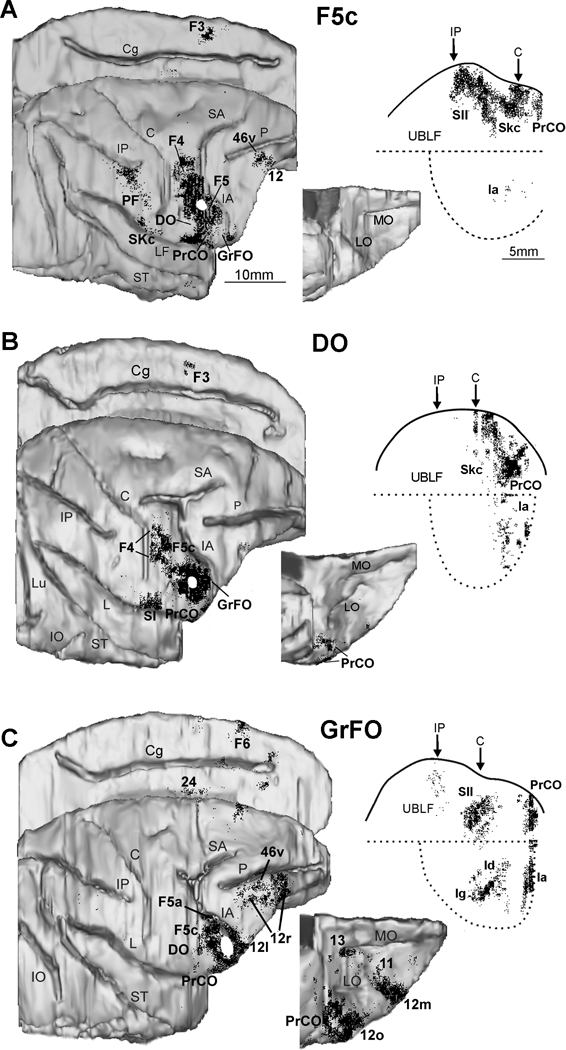
Figure 4.

Distribution of the retrograde labeling observed after injections in the ventral part of area F5c (A) and in the opercular areas DO (B) and GrFO (C). The labeling is shown in dorsolateral, medial, and bottom views of the 3D reconstructions of the injected hemispheres, and in 2D reconstructions of the lateral fissure (LF). Each dot corresponds to one labeled neuron. Each 2D reconstruction of the LF was aligned to correspond with the dorsal border of the insula indicated by a straight dotted line; the continuous line marks the lip of the bank, and the curved dotted line marks the border of the insula with the lower bank of the sulcus. Arrows mark the levels of the rostral tip of the intraparietal sulcus (IP) and of the rostralmost level of the central sulcus (C). The location of each tracer injection is shown as a white area on the dorsolateral view of the hemisphere. Scale bar in A applies also to B and C. Cg: cingulate sulcus; IO: inferior occipital sulcus; LO: lateral orbital sulcus; Lu: lunate sulcus; MO: medial orbital sulcus; UBLF: upper bank of the LF; other abbreviations as in Figure 1 (Modified from Gerbella et al. (2011) and Gerbella et al. (2016).
