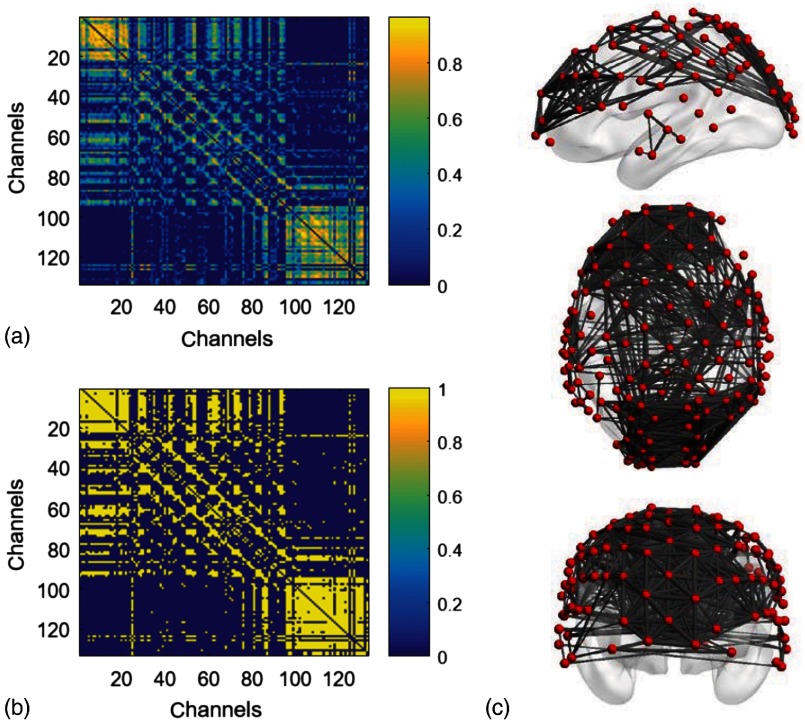
Fig. 2.
Construction of functional brain networks from fNIRS measurements. (a) A sample of adjacency matrix computed by cross correlation of resting-state cortical hemodynamic responses from one participant. (b) The corresponding binary matrix at the threshold of sparsity 0.3. (c) 3-D views (i.e., left-side, top, and front view) of the brain network derived from (b) at the sparsity of 0.3. Images were obtained using BrainNet Viewer software.37

