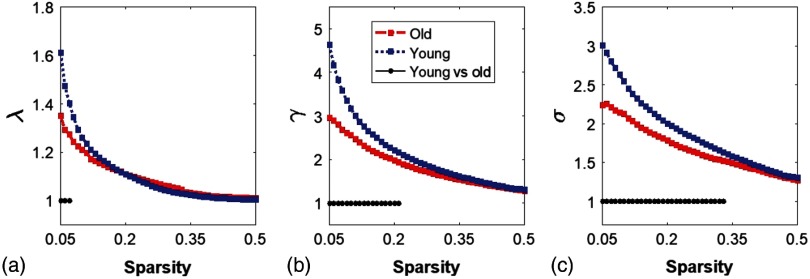
Fig. 4.
Small-worldness features in young and older adults. (a)–(c) The normalized characteristic path lengths (), normalized clustering coefficient (), and small-worldness () quantified from young adults (blue in the online version) and older adults (red in the online version), respectively. The black dots on the bottom of each panel indicate significant differences of each parameter between the two groups within the given sparsity range for , , and .

