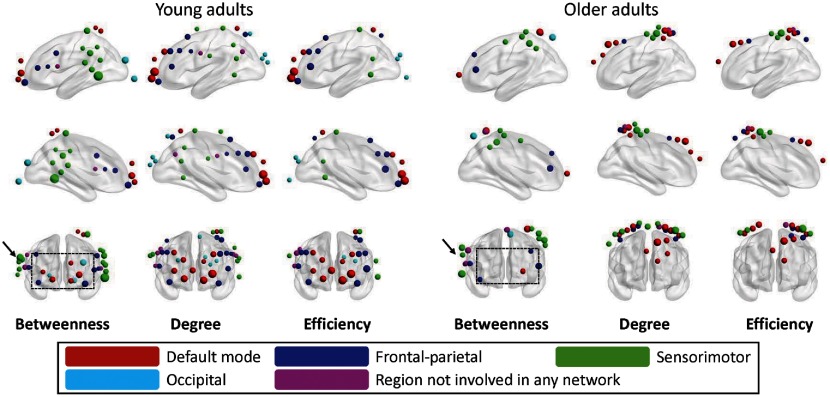
Fig. 6.
Hubs compared between young and older adults. For all three of betweenness centrality (), nodal degree (), and nodal efficiency (), (i) red dots represent the hubs within the DMN, (ii) blue dots represent the hubs within the FP network, (iii) green dots represent hubs within the SM network, (iv) azure represent hubs within the OC network, and (v) purple dots represent hubs that is NI in any network. The size of the dots represents the strength of three parameters.

