. 2018 Jun 29;9(29):6264–6270. doi: 10.1039/c8sc02380h

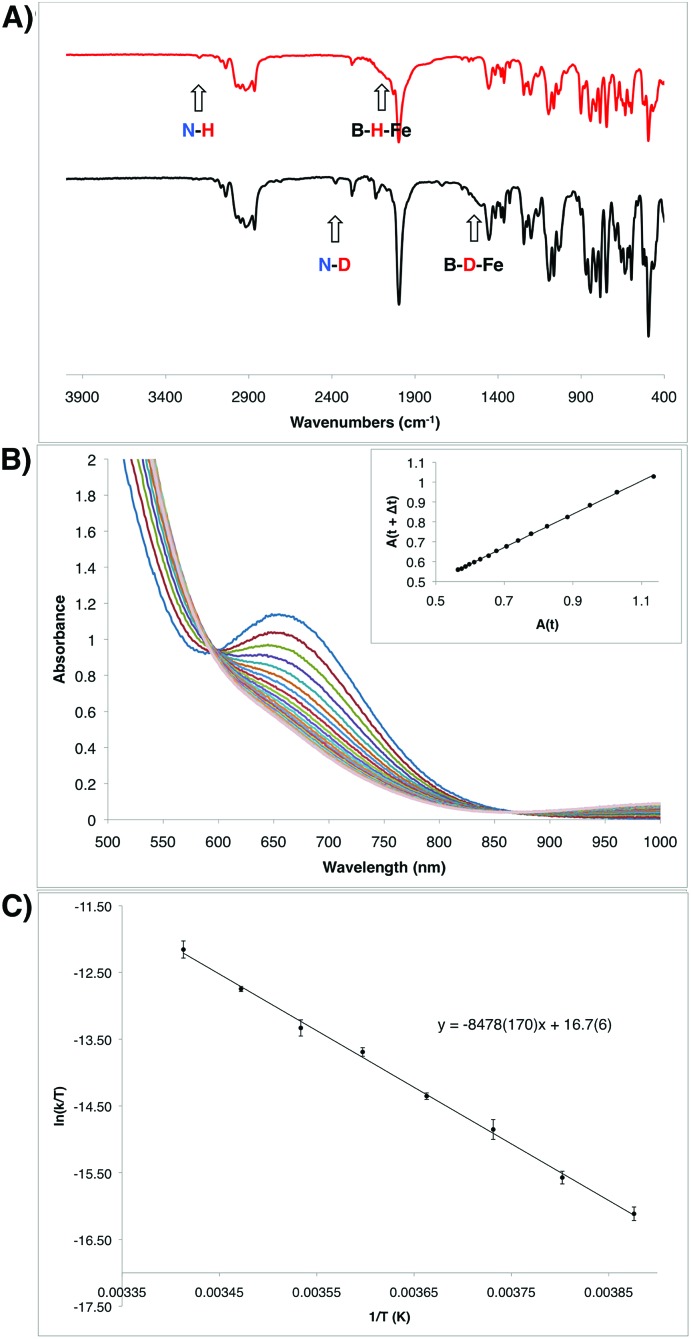
Fig. 5. (A) IR spectra of the hydrazido(1-) complexes 9 (top) and 9-D2 (bottom). (B) Transformation of the intermediate hydrazido(2-) complex 8 to the hydrazido(1-) complex 9 observed by UV-Vis spectroscopy in 6 minute intervals at 10 °C. Inset shows the corresponding linear plot of A(t) vs. A(t + Δt), which is consistent with a first order decay process (R2 = 0.99961). Rate constant: 4.98 × 10⁻⁴ s–1 (see ESI). (C) Eyring plot for the decay from 8 to 9 measured in 5 degree increments from –15 °C to 20 °C. Measurements were made in duplicate at each temperature. Eyring parameters: ΔH = 16.8(3) kcal mol–1; ΔS = –14(1) e.u.; ΔG = 20.9 kcal mol–1 (at 20 °C).

Fig. 5