. 2018 Jun 27;9(29):6271–6285. doi: 10.1039/c8sc01875h

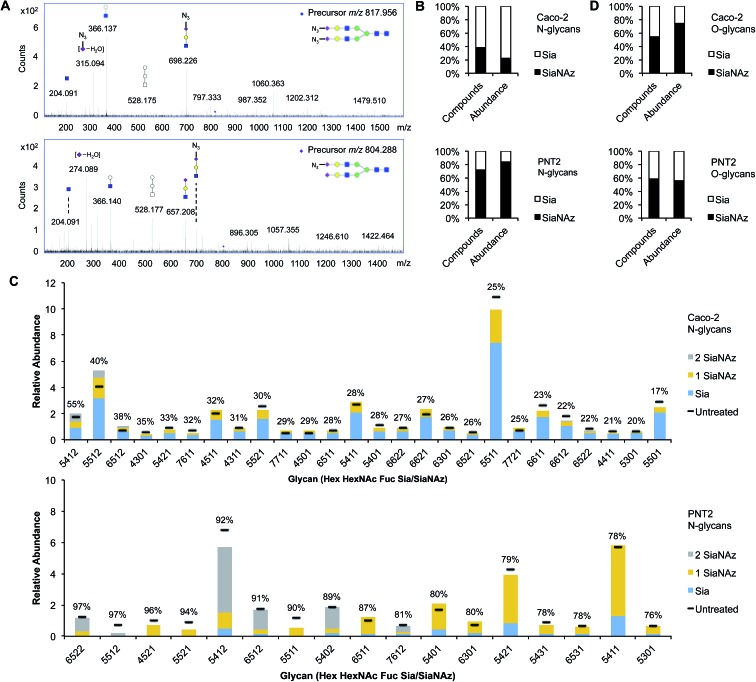
Fig. 2. Profiling SiaNAzylated N- and O-glycans of the cell surface. (A) MS/MS spectra of N-glycan structures that have doubly (top panel) or singly (bottom panel) incorporated SiaNAz. Fragment ions m/z 292.10 (dehydrogenated m/z 274.08) and m/z 333.11 (dehydrogenated m/z 315.08) indicate the presence of Sia and SiaNAz, respectively, in the selected glycan precursor. (B) Net percent incorporation of SiaNAz onto N-glycans. (C) Relative abundances of sialylated N-glycans on ManNAz-treated Caco-2 and PNT2 (threshold >0.5%). Bar graphs are arranged by order of percent incorporation, as indicated in the inset (high to low, left to right). (D) Net percent incorporation of SiaNAz onto O-glycans.

Fig. 2