. 2018 Jun 27;9(29):6271–6285. doi: 10.1039/c8sc01875h

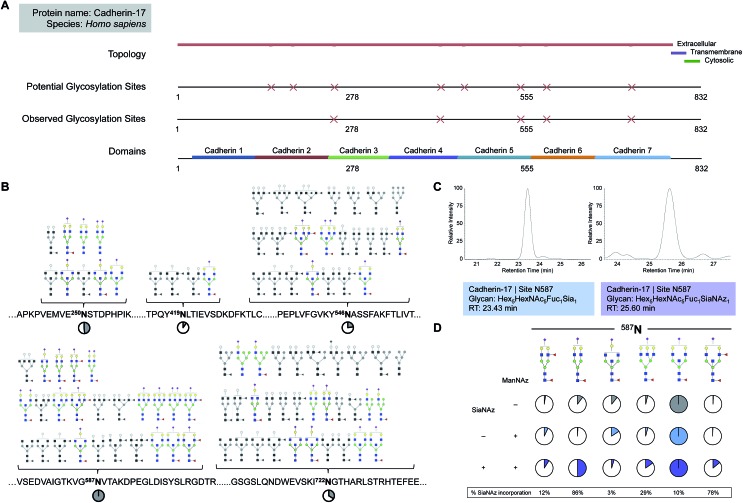
Fig. 3. Quantitation of site-specific incorporation of SiaNAz. (A) Features of the glycosylated membrane protein, cadherin-17, shown in sequence view from position 1 to 832. (B) Site-specific glycan structures observed on cadherin-17. Non-sialylated glycoforms are drawn in grayscale. Pie charts show the intensity of each site relative to the most abundant site, N587 (denoted as 100%). (C) Chromatograms of the most abundant sialylated and SiaNAzylated glycoforms expressed on cadherin-17 at N587. (D) Site-specific abundances of sialylated glycoforms identified on cadherin-17 at N587. Pie charts indicate the contribution of each glycoform relative to the most abundant glycoform observed at each site per group. Colors differentiate between untreated and treated groups (+/– ManNAz) in addition to unmodified and modified sialic acid (+/– SiaNAz).

Fig. 3