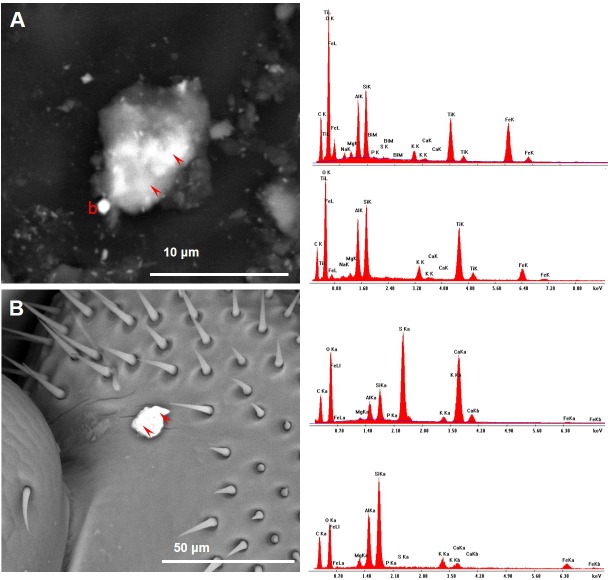
Figure 15. Honey bees collected near the cement plant also displayed some dusts whose chemical composition appeared different according to the point of analysis.
(A) The arrowheads indicate the points of spectra acquisition (EDX spectra on the right): the brighter part of the aggregate showed the presence of bismuth, that was lacking in the darker one; b = PM0.8 of baryte. (B) The arrowheads indicate the points of spectra acquisition (EDX spectra on the right): the upper part of the dust was mainly composed by gypsum; the lower part has a composition compatible with a fly ash.

