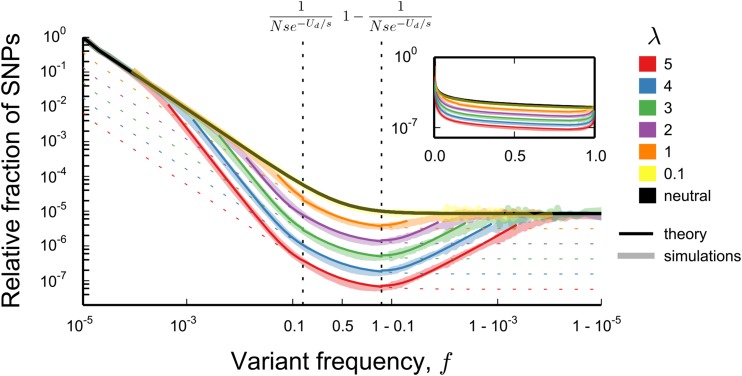
Figure 2.
Comparison between the theoretical predictions for the site frequency spectrum and Wright–Fisher simulations. In all simulations, while the parameter varies from 5 to 0.1 (values shown on figure). Dashed lines show the expectations for a neutral population at reduced effective population size At frequencies smaller than (where ) and larger than the theoretical predictions agree with the predictions for a neutral population with census size N (black line). Within the range the theoretical predictions (Equation 2) are given by colored lines. A single theory curve was constructed from Equation 2 by joining the piecewise forms using sigmoid functions (for details see Constructing a Single Curve from Piecewise Asymptotic Functions in Appendix I). Note that this involves fitting constants to the curve, for reasons explained in Contribution from the Peaks of Trajectories and Constructing a Single Curve from Piecewise Asymptotic Functions in Appendix I. The values of the constants used are tabulated in Table I1. In simulations in which whereas for smaller λ. In all simulations, the per-individual, per-generation neutral mutation rate is and site frequency spectra were obtained from these simulations as described in the caption of Figure 1.

