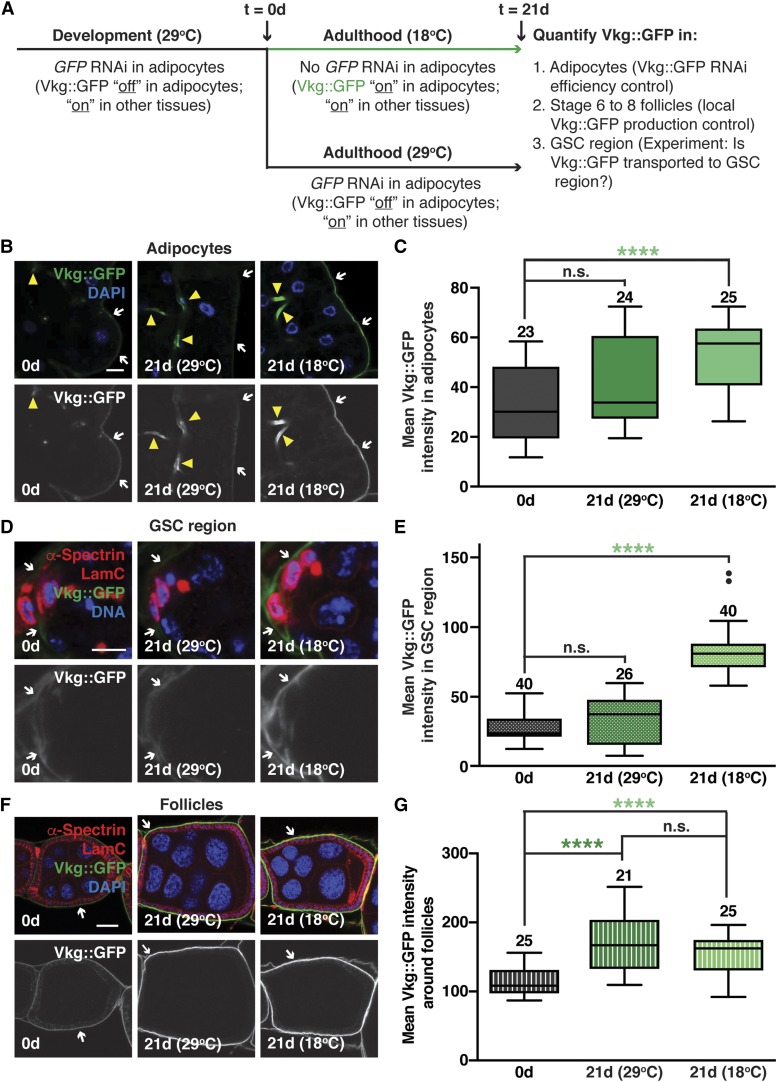
Figure 2.
Collagen IV is transported from adipocytes to the GSC region in adult females. (A) Experimental design for adipocyte-specific GFP RNAi and analysis of Vkg::GFP distribution. Vkg::GFP was knocked down specifically during development using the 3.1Lsp2-Gal4 driver and a previously described UAS-GFP shRNA. After eclosion, females were immediately dissected, maintained at 29° (to maintain GFP RNAi), or switched to 18° (GFP RNAi off). After 21 days, females at 29 or 18° were dissected and analyzed for GFP fluorescence intensity. (B) Adipocytes from newly eclosed females (0d) and 21-day old (21d) females maintained at 29 or 18° showing higher levels of Vkg::GFP (arrows) at 18° (when adipocyte-specific GFP RNAi is off). GFP (green), Vkg::GFP; DAPI (blue), nuclei. Vkg::GFP shown in grayscale in bottom panels. Arrowheads indicate trachea. Bar, 10 µm. (C) Box-and-whisker plot of mean Vkg::GFP intensity in adipocytes for experiment shown in (B). (D) Germaria from females as in (B) showing that higher levels of Vkg::GFP in the GSC niche region result specifically from Vkg::GFP expression in adult adipocytes. GFP (green), Vkg::GFP; α-Spectrin (red), fusome; LamC (red), cap cell nuclear lamina; DAPI (blue), nuclei. Bar, 5 µm. (E) Box-and-whisker plot of mean Vkg::GFP intensity in the GSC region for experiment shown in (D). (F) Representative images of stage 6–8 egg chambers from females showing that levels of Vkg::GFP in developing egg chambers do not depend on Vkg::GFP expression in adult adipocytes. Bar, 25 µm. (G) Box-and-whisker plot of mean Vkg::GFP intensity for experiment in (F). **** P < 0.0001, Mann–Whitney U-test. Sample sizes are included above. See also Figure S3. GSC, germline stem cell; n.s., not significant; RNAi, RNA interference; shRNA, short hairpin RNA; UAS, upstream activating sequence.

