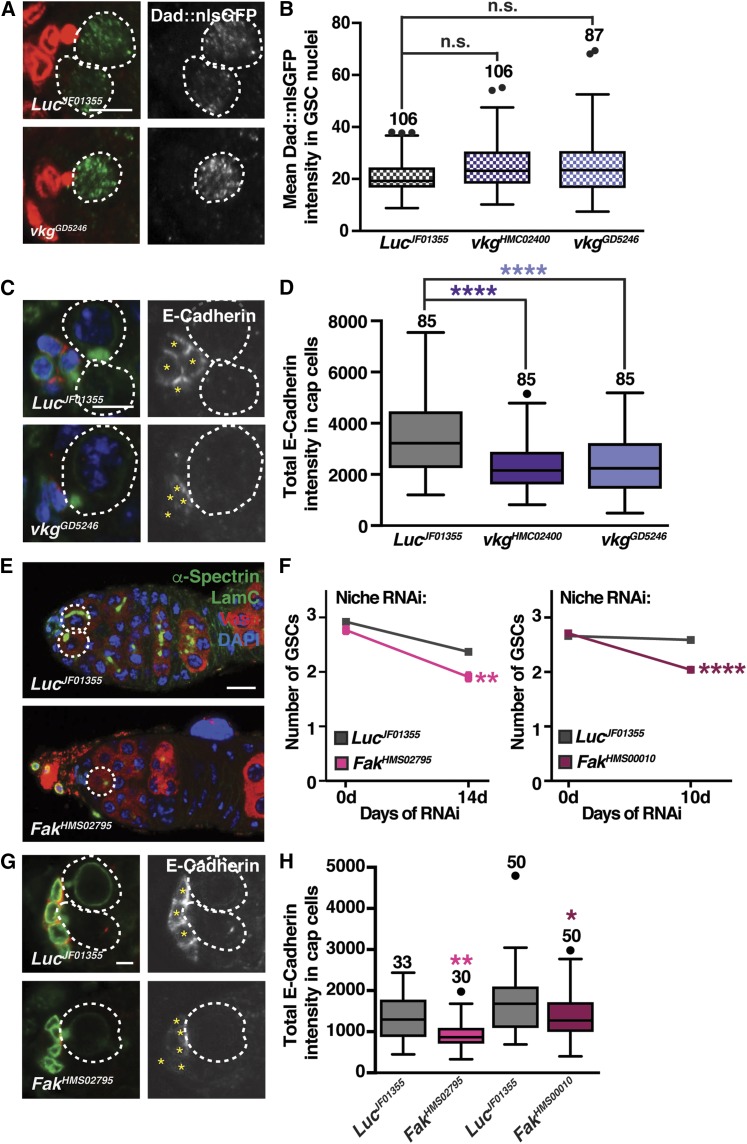
Figure 3.
Adipocyte-derived collagen IV positively regulates E-cadherin levels at the GSC-niche interface through FAK. (A) Germaria from females at 10 days of adipocyte-specific Luc control or vkgGD5246 RNAi. GFP (green), Dad::nlsGFP; LamC (red), cap cell nuclear lamina; α-Spectrin (red), fusome. Dad::nls shown in grayscale in panels on the right. GSC nuclei are outlined. Bar, 5 µm. (B) Box-and-whisker plot of mean Dad::nlsGFP intensity for experiment in (A). (C) Germaria from females described in (A). E-cadherin (red); LamC (green), cap cell nuclear lamina; α-Spectrin (green), fusome; DAPI (blue), nuclei. E-Cadherin shown in grayscale in panels on the right and asterisks indicate cap cells. Bar, 5 µm. (D) Box-and-whisker plot of mean E-cadherin intensity for experiment in (C). Sample sizes in (B and D) are included above boxes. **** P < 0.0001, Mann–Whitney U-test. (E) Germaria from females at 14 days of knockdown of Luc or Fak in the adult niche showing Vasa (germ cells, red), α-spectrin (fusome, green), LamC (nuclear lamina, green), and DAPI (DNA, blue). Bar, 10 µm. (F) Average number of GSCs per germarium at 0, 10, and 14 days of bab1ts-mediated induction of RNAi against Fak or Luc (mean SEM; ** P < 0.01 and **** P < 0.0001, two-way ANOVA with interaction). (G) Germaria at 10 days of adipocyte-specific Luc or Fak RNAi labeled for E-cadherin (red), LamC (nuclear lamina, green), and α-spectrin (fusome, green). E-cadherin shown in grayscale in panels on the right and asterisks indicate cap cells. Bar, 2.5 µm. (H) Box-and-whisker plot of mean E-cadherin intensity. Sample sizes are included above. **** P < 0.0001, Mann–Whitney U-test. The number of germaria analyzed is shown above each box. See also Figure S4. FAK, focal adhesion kinase; GSC, germline stem cell; n.s., not significant; RNAi, RNA interference.

