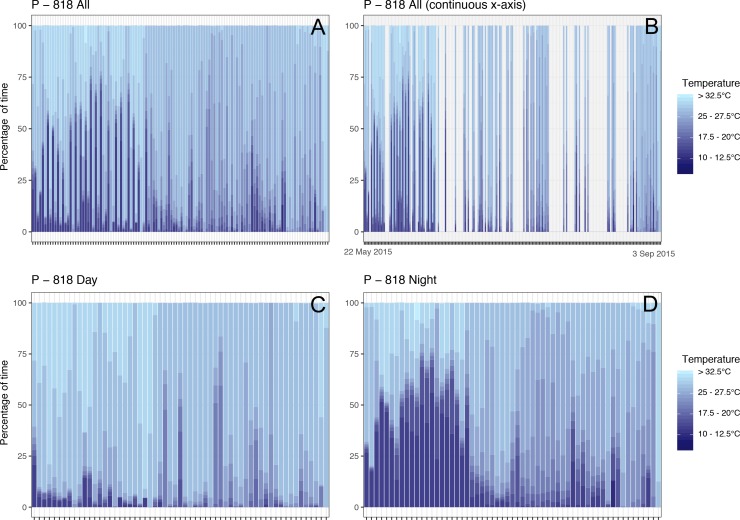
Figure 5. Time-at-temperature time-series for shark P-818 that was tagged in TRNP and spent its entire track within the Sulu Sea.
(A) is the entire histogram data, with a chronological x-axis, (B) has a continuous x-axis to illustrate the gaps in TAT data, (C) are all histograms from the daytime, and (D) are all histograms from the nighttime.

