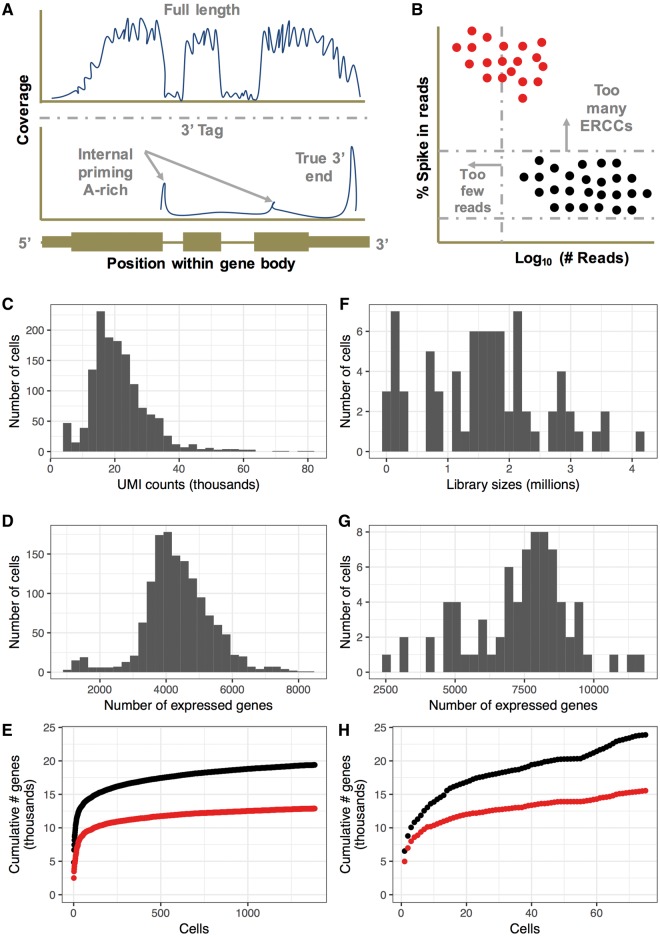
Figure 1.
Comparison of 10x and SMART-seq2. (A) The protocols differ in the fraction of the gene covered by reads. While full-length protocols (such as Smart-Seq2) have reads covering the entire gene body, 3′-tag methods (such as 10x) concentrate reads upstream of the polyA tail or internally upstream of A-rich regions of the transcript. (B) Percentages (%) of reads aligning to ERCCs can be used in Smart-Seq2 data sets to identify high-quality cells. In comparison, non-ERCC data sets rely on library size/total UMI counts and the number of features detected. (C–E) Characteristics of a representative 10x data set of 1384 growing IMR90 cells. (F–H) Characteristics of a representative Smart-Seq2 data set of 75 growing IMR90 cells. (E and H) The cumulative number of genes detected at > 0 reads (black) or > 1 UMI or 10 reads (red) across cells in each data set.

