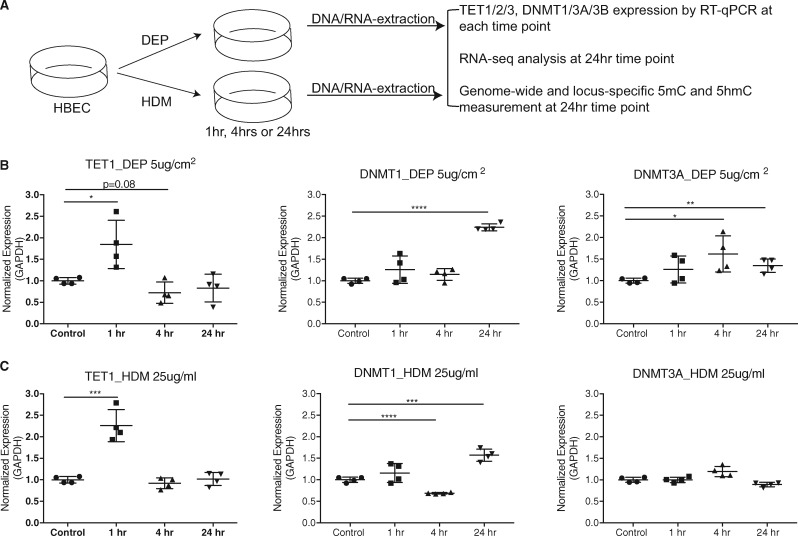
Fig. 1:
time-specific responses of TET1 and DNMT expression to DEP and HDM exposures in HBECs. (A) Experimental design. HBECs were exposed to Phosphate-buffered saline (PBS), DEP (5 μg/cm2) or HDM (25 μg/ml). Expression of TET1, DNMT1 and DNMT3A was measured by RT-qPCR. (B) and (C) Expression values (normalized to GADPH) were further normalized to the mean of controls at the indicated time points. Mean values from four biological replicates are represented as the mean ± SD. Treated group were compared to controls using a two-sided Student’s t test. *P < 0.05, **P < 0.01, ***P < 0.001, n.s. represents not significant.

