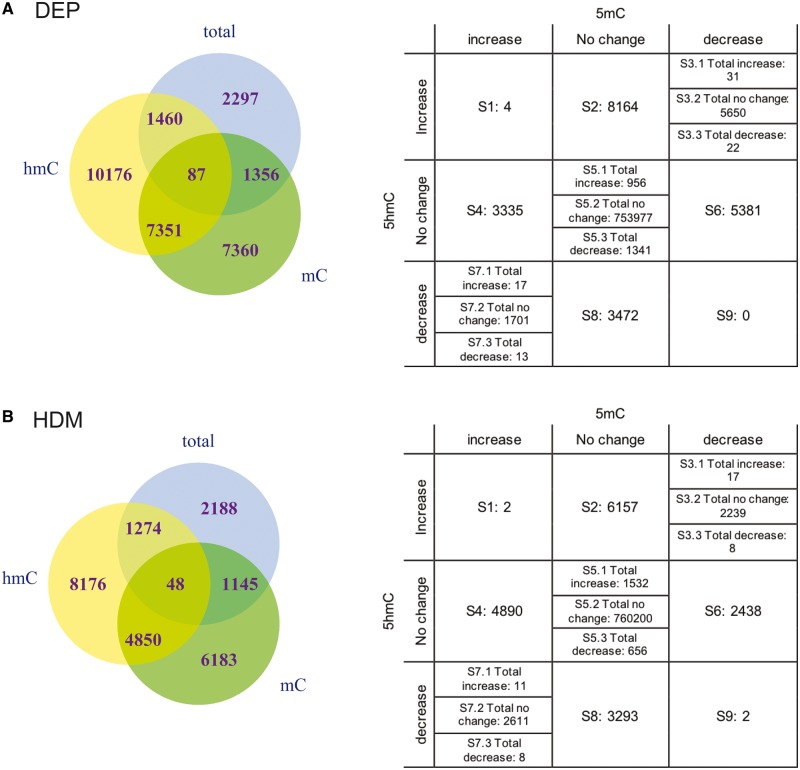
Fig. 2:
exposures to DEP and HDM alter 5mC + 5hmC, 5mC and 5hmC in HBECs. (A) Venn diagram showing the degree of overlap between sites with 5mC + 5hmC, 5mC and 5hmC changes in response to 24 h treatment of 5 μg/cm2 DEP. The table lists number of CpG sites with different directions of changes in 5mC and 5hmC. (B) Venn diagram for 5mC + 5hmC, 5mC and 5hmC changes in response to 24 h treatment of 25 μg/ml HDM. The table lists number of CpG sites with different directions of changes in 5mC and 5hmC.

