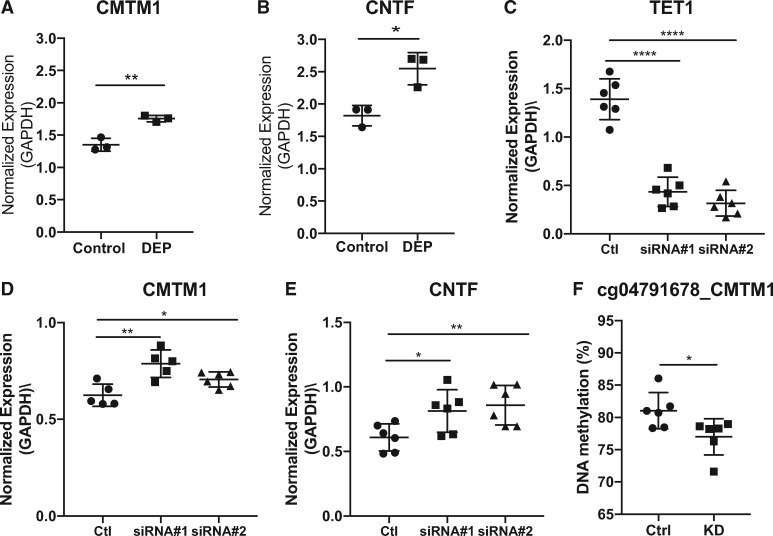
Fig. 5:
regulation of CMTM1 and CNTF expression by exposures and TET1. HBECs were treated with 5 μg/cm2 DEP and expression levels of CMTM1 (A) and CNTF (B) were measured and normalized as described in Fig. 1. Mean values from three biological replicates are represented as the mean ± SD. The expression levels of TET1, CMTM1 and CNTF after TET1 siRNA knockdown are shown in C, D and E. F. Methylation of cg04791678 in CMTM1 after siRNA #1 knockdown of TET1. Mean values from six biological replicates are represented as the mean ± SD. Groups were compared using a two-sided Student’s t test. *P < 0.05, **P < 0.01, ***P < 0.001, n.s. represents not significant.

