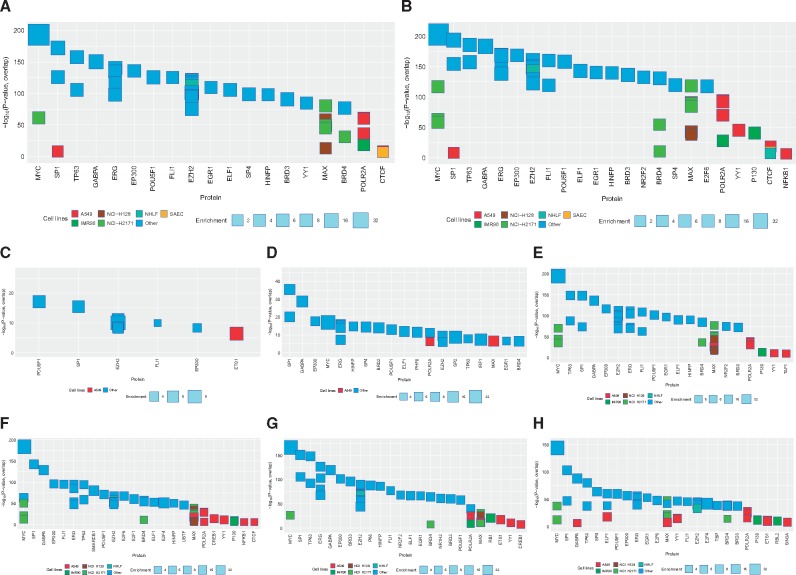
Fig. 6:
potential TF binding at regions with 5hmC and 5mC changes following DEP and HDM exposures. We estimated the significance of the degree of overlap between genomic regions with exposure induced 5hmC and/or 5mC changes and each member of a large library of transcription factor, co-factor, and other protein ChIP-seq datasets (see Methods). The top 30 significant results are shown regardless of cell type, along with results from lung related datasets passing a P < 10−6 significant threshold. The X-axis indicates the protein, in decreasing order of significance. The Y-axis indicates the significance (–log P-value) of the overlap of the given ChIP-seq dataset. The size of each box indicates the fold-enrichment relative to background (see Methods). The color of each box indicates the cell type: lung-related cell types are shown in multi-color, and non-lung cell types are shown in dark blue (see key below). (A) all locations with exposure-induced 5hmC changes; (B) all locations with exposure-induced 5mC changes; (C) 5hmC gain, 5mC no change; (D) 5mC loss, 5hmC gain; (E) 5mC gain, 5hmC no change; (F) 5mC loss, 5hmC no change; (G) 5mC gain, 5hmC loss; (H) 5hmC loss, no changes in 5mC. Detailed classification of 5mC and 5hmC changes are shown in Fig. 3B.

