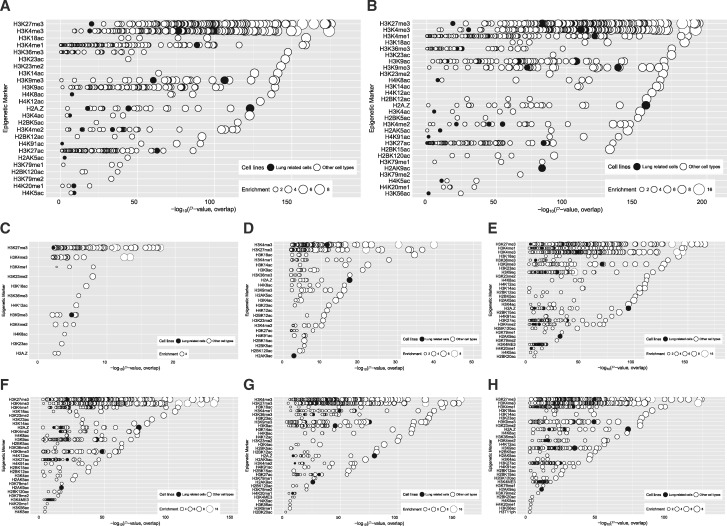
Fig. 8:
overlap significance between 5mC or 5hmC-marked regions and histone marks. The significance of the degree of overlap between genomic regions with exposure induced 5mC/5hmC changes and each member of a large library of histone mark ChIP-seq datasets was estimated (see Methods). Histone marks with at least one significant result (P < 10−2) are shown. The Y-axis indicates the histone mark, in decreasing order of significance. The X-axis indicates the significance (–log P-value) of the overlap of the given dataset. The size of each circle indicates the fold-enrichment relative to background (see Methods). (A) all locations with exposure-induced 5hmC changes; (B) all locations with exposure-induced 5mC changes; (C) 5hmC gain, 5mC no change; (D) 5mC loss, 5hmC gain; (E) 5mC gain, 5hmC no change; (F) 5mC loss, 5hmC no change; (G) 5mC gain, 5hmC loss; (H) 5hmC loss, no changes in 5mC.

