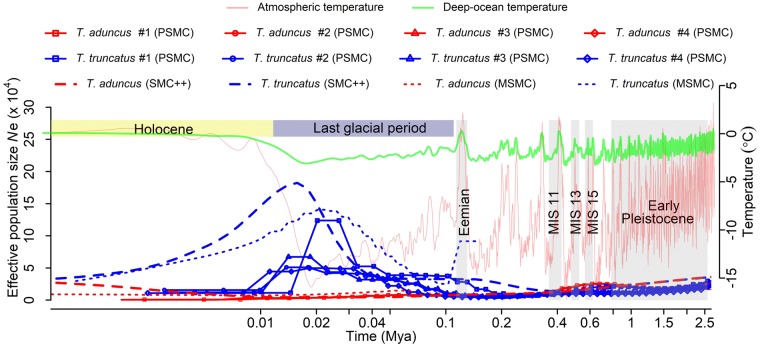
Fig. 2.
Contrasting demographic changes of the two bottlenose dolphin species in the last glacial, inferred from genome sequences using PSMC, MSMC, and SMC++. MIS, Marine Isotope Stage. All dolphins whose genomes are analyzed here are from Northwest Pacific. See supplementary table S1, Supplementary Material online for detailed information of individual dolphin genomes.

