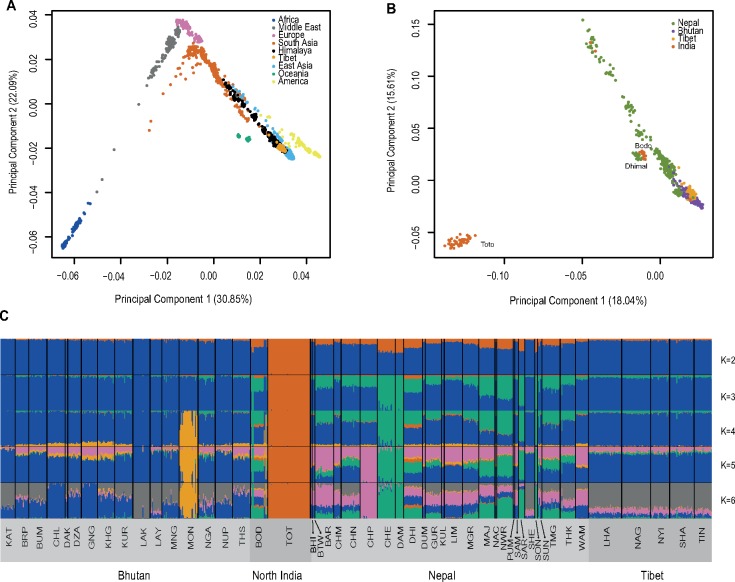
Fig. 2.
Genetic structure of the Himalayan region populations from analyses using unlinked SNPs. (A) PCA of the Himalayan and HGDP-CEPH populations. Each dot represents a sample, coded by region as indicated. The Himalayan region samples lie between the HGDP-CEPH East Asian and South Asian samples on the right-hand side of the plot. (B) PCA of the Himalayan populations alone. Each dot represents a sample, coded by country or region as indicated. Most samples lie on an arc between Bhutanese and Nepalese samples; Toto (India) are seen as extreme outlier in the bottom left corner, while Dhimal (Nepal) and Bodo (India) also form outliers. (C) ADMIXTURE (K values of 2–6, as indicated) analysis of the Himalayan samples. Note that most increases in the value of K result in single population being distinguished. Population codes in (C) are defined in supplementary table S1, Supplementary Material online.

