
Figure 4. Correlation of pCT findings with resp onse as represented by best change in sum of target lesion diameters.
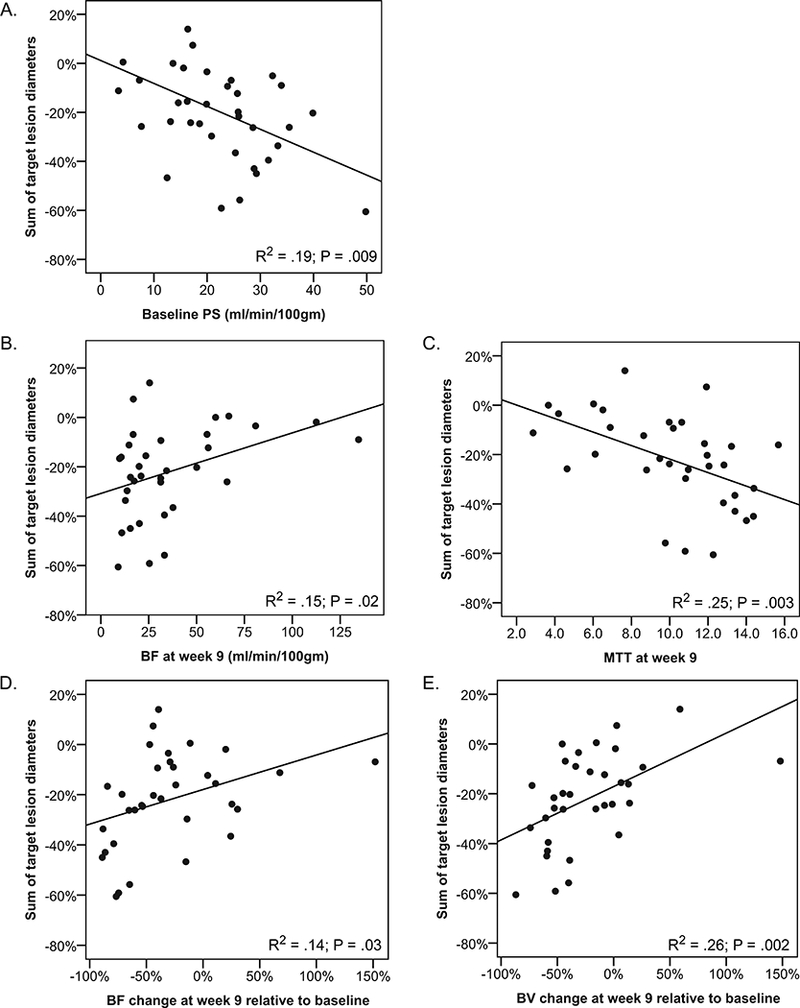
Each point represents one patient. P values are from Pearson correlation statistics. A. Baseline PS among 38 patients with baseline measurements. B. Post-treatment blood flow (BF) at week-9 among 36 patients with post-treatment measurements. C. Post-treatment mean transit time (MTT) at week-9 among 36 patients with post-treatment measurements.. D. Relative change in BF at week-9 among 36 patients with paired measurements. E. Relative change in blood volume (BV) at week-9 among 36 patients with paired measurements.